Map Indicators
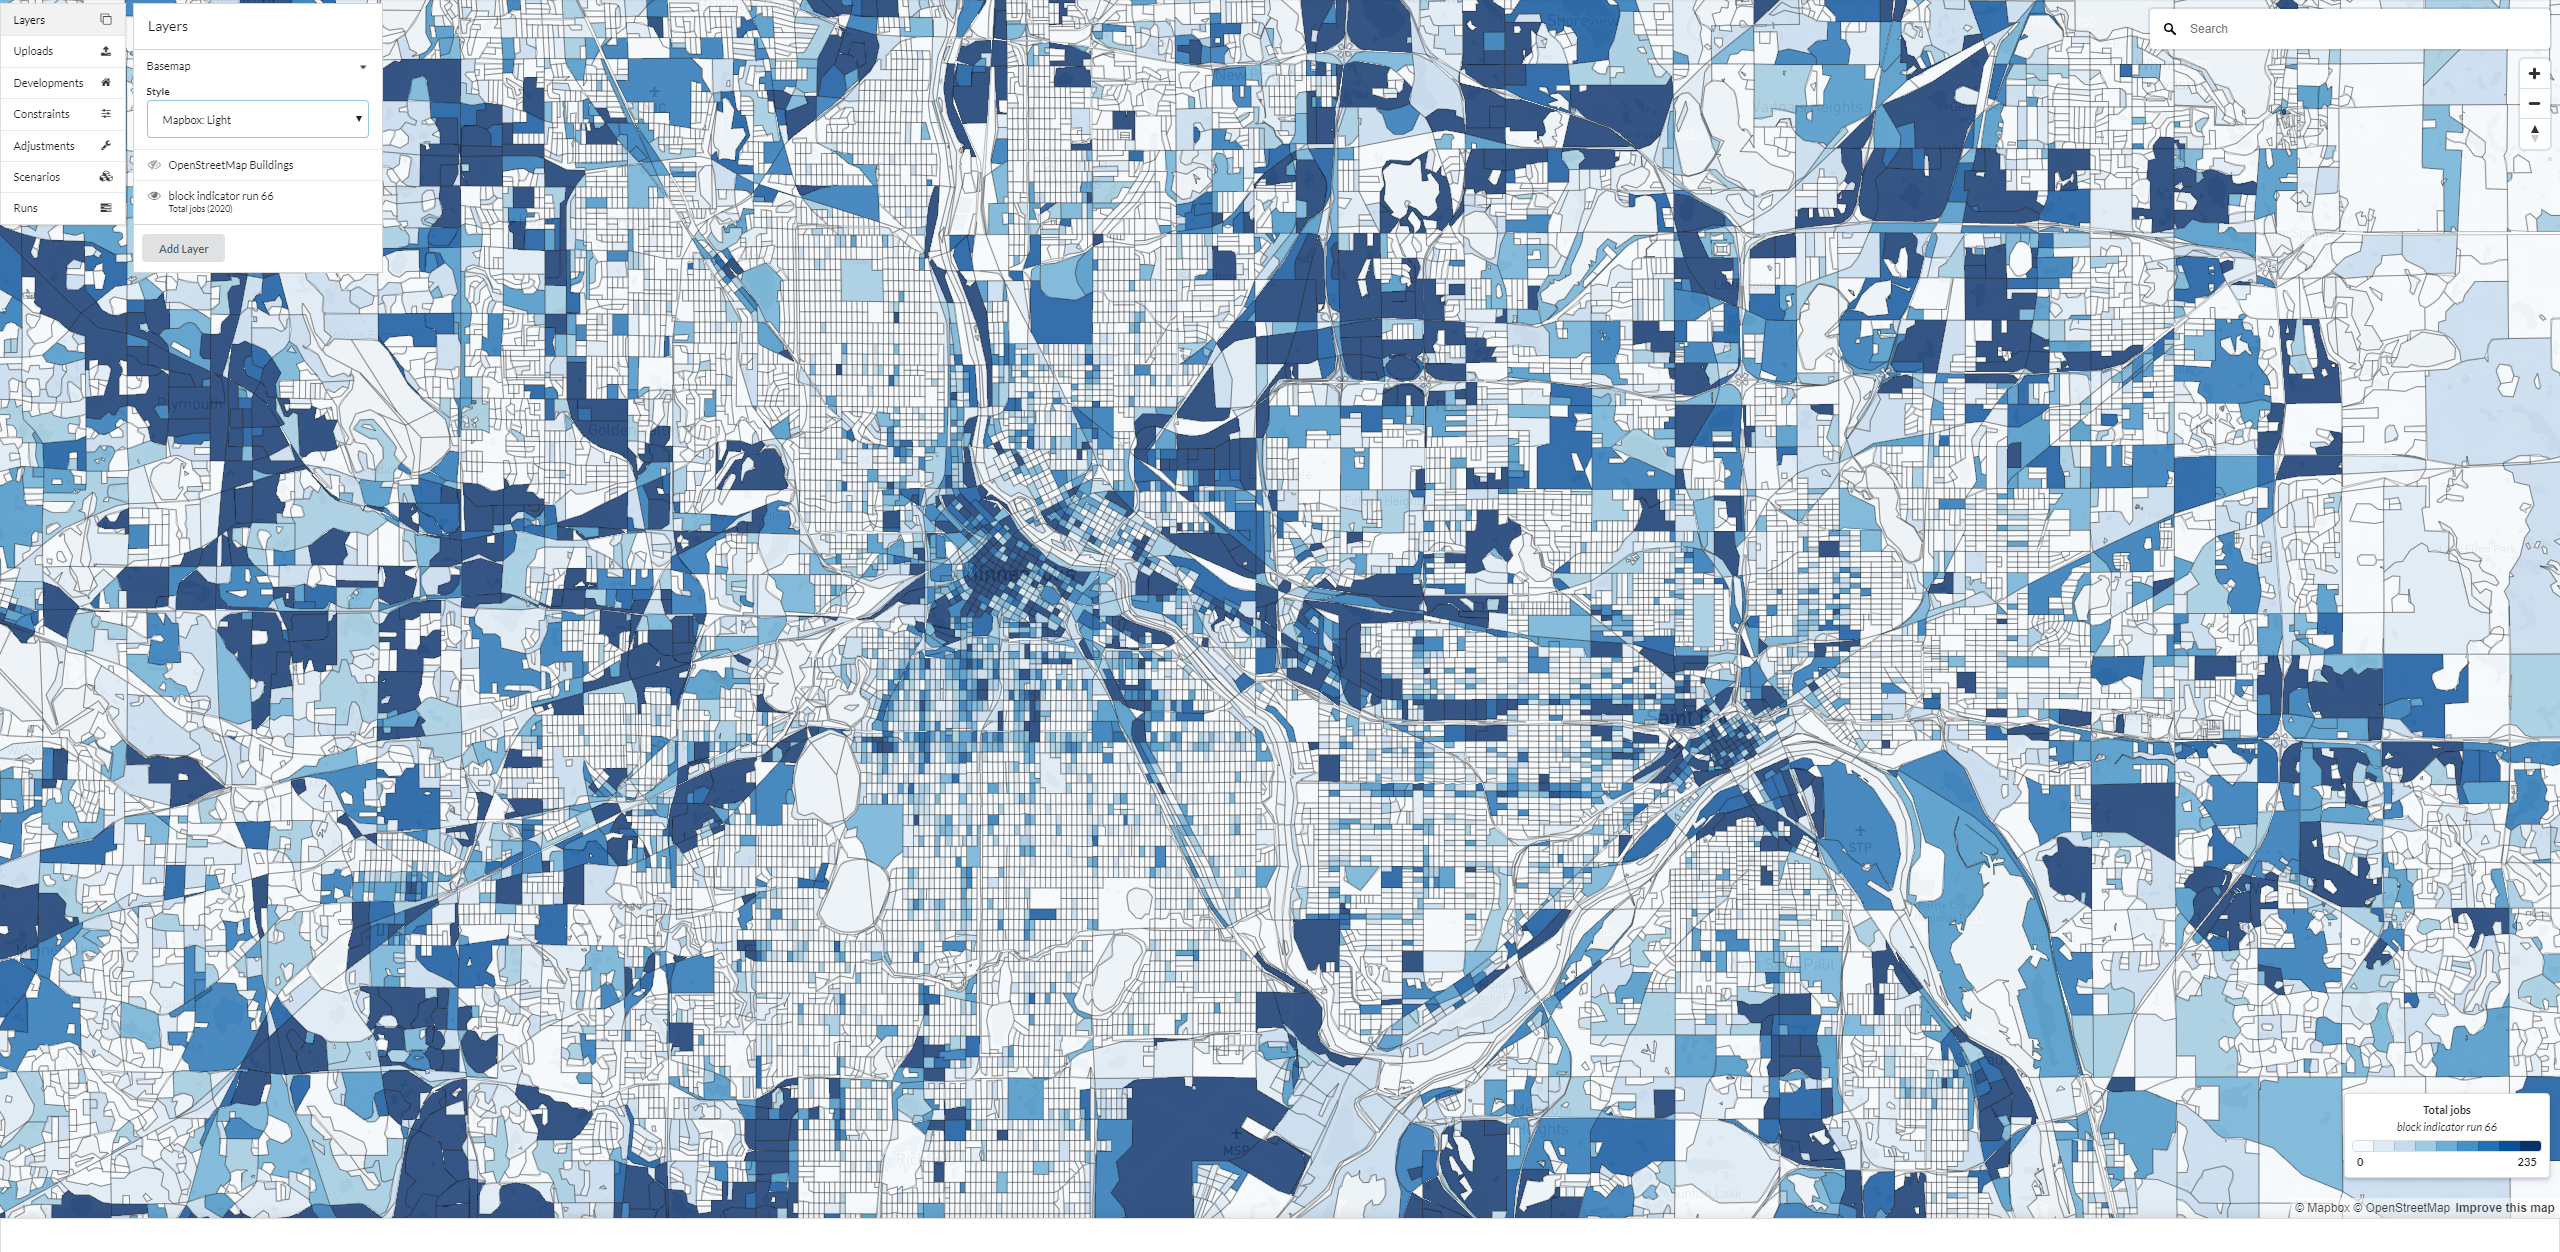
After a successful simulation run, a selection of spatial indicators (e.g. derived variables) for that run are available to visualize as layers on the map if your simulation was configured to export pre-defined indicator layers prior to the run. In addition, indicators uploaded manually using the indicator upload tool will be available for visualization on the map. Indicator layers on the 3D map can be viewed just like normal map layers by using the layers menu and time series indicators can be visualized using the time slider. See the time slider section for more information. See here for more information on how to use the layers menu. All indicator layers can be renamed or deleted by going to the Uploads page and opening the Indicators upload section. See here for more information.
Indicators can be automatically exported at any spatial level that can be associated to your model base data geography. Depending on your model these can include by default: parcels and zones and users in the United States: Census blocks, block groups, tracts, counties, states, and PUMAs for the base year and a range of simulation years. For metadata on the default layers available see here. Optionally, indicators are also available for export to a user uploaded zonal (such as a TAZ) geography which can be specified when composing a scenario. Spatial indicators can also be exported as layers for any customized geography. To do so, contact us here and provide us a shapefile of the geography.
All model types (e.g. Block, Zone, Parcel) can have a customized list of spatial indicators autogenerated. However, due to the Block model’s use of standardized data there are a set of default pre-selected spatial indicators available here. Parcel and zone model spatial indicators can vary widely based on the type of base data utilized. Parcel and zone model indicators can be fully customized depending on the customization of your model system and the data utilized. Please note that the number of and the spatial resolution of indicators may impact simulation data export run times.
Note
If you do not see a pre-calculated indicator you require, you can request new indicators to be added to the next version by submitting a feature request as long as your model base data supports the calculation of the indicator.
Calculation of Indicators
Indicator variables can be configured to be auto-generated upon completion of each simulation run and can be visualized as spatial layers on the map. All indicators are calculated at the base data level of geography (e.g. Census block, parcel or zone) and are typically summed or averaged to larger geographies.
Note
The types of indicators exported at the end of the simulation will be dependent upon your needs determined through your model development consulting contract and can be customized. The indicators displayed in this section are for example only.
Note
If viewing or using indicators generated for your user uploaded TAZ file, note that if any base data geometries were found outside of your TAZ boundaries or were unable to be intersected with your uploaded zone polygons, you will see an additional zonal id of -1 that will hold aggregated indicator values for all base data polygons that fell outside of your TAZ boundaries and were unable to be tagged with a zone.
Indicator Metadata
Indicator layers automatically generated by simulation runs will be given the following default metadata properties:
Indicator layers will be given names as configured by your specific model implementation but will typically follow this format: [geography] indicator run [simulation run unique identifier] e.g. blockgroup indicator run 24. Indicator layers will also have information on the key columns corresponding to the indicator and geography data. Layers will have an upload date timestamp that reflects when the layer was exported to UrbanCanvas.
Uploading Ad-hoc Indicators
A time series indicator uploader is available to use as a convenience to manually upload ad-hoc indicator layers that are not generated directly from a simulation run. Indicators must be a time series CSV file and can be linked to any uploaded shapefile to use as the indicator geometry. See the time series indicator upload section for more information. These layers can be visualized on the map in the same manner as simulation exported indicator layers.
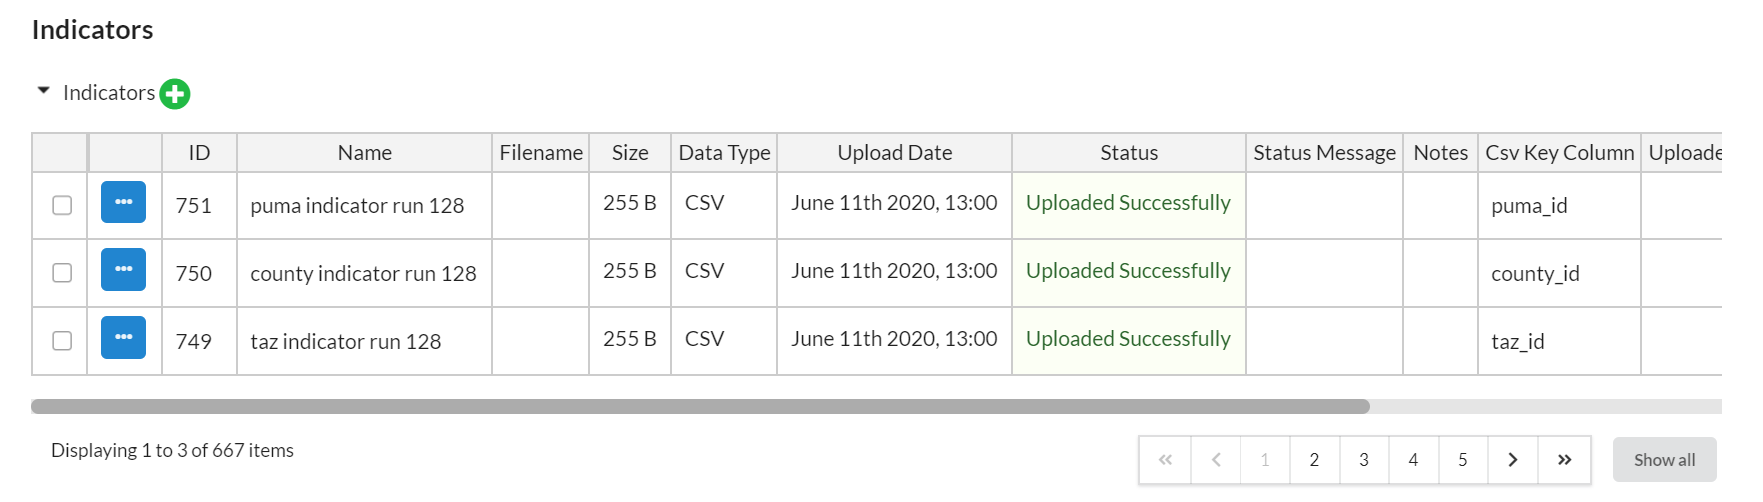
Deleting and Renaming Indicator Layers
All indicator layers can be renamed or deleted by going to the Uploads page and opening the Indicators upload section. All simulation exported indicator layers will be listed here along with any indicators manually uploaded. To remove an indicator layer from the layers menu or rename an indicator layer you can do so from within this table. See the time series indicator upload section for more information.
Block model example layers
The block model comes pre-loaded by with a set of indicator calculations available by default. Indicators can be fully customized depending on the customization of your model system and the data utilized. This list is intended as a example of indicators that can be generated and is not exhaustive.
See the table below for details on what variables are included by default and how they are calculated. See the Indicator Spatial Aggregation table below for details on how block level indicators are aggregated to higher level geographies.
Indicator |
Calculation Description |
|---|---|
Average household annual income within 3 km |
Accessibility score based on the average household annual |
Average residential unit rent ($) |
Mean rent value in dollars of all residential units with ‘rent’ tenure |
Average residential unit rent within 5 km |
Accessibility score based on the average residential unit |
Average residential unit value ($) |
Mean sale price in dollars of all residential units with ‘own’ tenure |
Households per acre |
Sum of households normalized by land area in acres |
Jobs per acre |
Sum of jobs normalized by land area in acres |
Mean income ($) |
Mean annual household income |
Median income ($)* |
Median annual household income |
Residential unit capacity |
Sum of residential unit capacity as dictated by zoning/constraints |
Residential units per acre |
Sum of residential units normalized by land area in acres |
Total area in acres |
Sum of land area of the geography |
Total employment capacity |
Sum of employment spaces |
Total household homeowners |
Sum of homeowner households |
Total household renters |
Sum of renter households |
Total households |
Sum of households |
Total jobs |
Sum of jobs of all sectors |
Total jobs accessible within 20 km along the |
Accessibility score based on number of jobs within 20 |
Total jobs accessible within 5 km along the |
Accessibility score based on number of jobs within 5 |
Total population |
Sum of population |
Total population accessible within 1.5 km |
Accessibility score based on number of people within 1.5 |
Total residential units |
Sum of residential units of all residential building types |
Total residential units accessible within 3 km |
Accessibility score based on number of residential units |
Total workers |
Sum of workers |
Vacant employment spaces |
Total jobs subtracted from total employment spaces |
Vacant residential units |
Total households subtracted from total residential units |
Mean household size* |
Mean number of persons in a household |
Total jobs in sector 11** |
Agriculture, Forestry, Fishing and Hunting |
Total jobs in sector 21** |
Mining, Quarrying, and Oil and Gas Extraction |
Total jobs in sector 22** |
Utilities |
Total jobs in sector 23** |
Construction |
Total jobs in sector 3133** |
Manufacturing |
Total jobs in sector 42** |
Wholesale Trade |
Total jobs in sector 4445** |
Retail Trade |
Total jobs in sector 4849** |
Transportation and Warehousing |
Total jobs in sector 51** |
Information |
Total jobs in sector 52** |
Finance and Insurance |
Total jobs in sector 53** |
Real Estate and Rental and Leasing |
Total jobs in sector 54** |
Professional, Scientific, and Technical Services |
Total jobs in sector 55** |
Management of Companies and Enterprises |
Total jobs in sector 56** |
Administrative and Support and Waste Management |
Total jobs in sector 61** |
Educational Services |
Total jobs in sector 62** |
Health Care and Social Assistance |
Total jobs in sector 71** |
Arts, Entertainment, and Recreation |
Total jobs in sector 72** |
Accommodation and Food Services |
Total jobs in sector 81** |
Other Services [except Public Administration] |
Total jobs in sector 92** |
Public Administration |
Household growth* |
Percent household growth for each geography |
Job growth* |
Percent job growth for each geography |
Residential unit growth* |
Percent of residential unit growth for each geography |
Share of household growth* |
Share of household growth for each geography |
Share of job growth* |
Share of job growth for each geography |
Share of residential unit growth* |
Share of residential unit growth for each geography |
Total households with annual household income less than 30k** |
Sum of households |
Total households with annual household income between 30k-60k** |
Sum of households |
Total households with annual household income between 60k-100k** |
Sum of households |
Total households with annual household income between 100k-150k** |
Sum of households |
Total households with annual household income between 150k-200k** |
Sum of households |
Total households with annual household income greater than 200k** |
Sum of households |
Total persons with age between 0-5** |
Sum of persons |
Total persons with age between 5-13** |
Sum of persons |
Total persons with age between 13-18** |
Sum of persons |
Total persons with age between 18-21** |
Sum of persons |
Total persons with age between 21-30** |
Sum of persons |
Total persons with age between 30-40** |
Sum of persons |
Total persons with age between 40-50** |
Sum of persons |
Total persons with age between 50-60** |
Sum of persons |
Total persons with age between 60-64** |
Sum of persons |
Total persons with age between 64-70** |
Sum of persons |
Total persons with age between 70-75** |
Sum of persons |
Total persons with age between 75-80** |
Sum of persons |
Total persons with age between 80-85** |
Sum of persons |
Total persons with age between 85-90** |
Sum of persons |
Total persons with age greater than 90** |
Sum of persons |
*Available as a chart or table export, not available as a map layer by default. **Variable reflect default indicators, exact variable may differ based on whether or not custom jobs data or custom annual household income or person age ranges are specified by the user. Available as a chart or table export, not available as a map layer by default.
Note
All dollar amounts are in 2013 dollars unless you have requested a different reference year. To request a different reference year contact us here.
Indicator |
Aggregation Method |
|---|---|
Total jobs |
sum |
Total households |
sum |
Total residential units |
sum |
Total employment capacity |
sum |
Total area in acres |
sum |
Average residential unit rent ($) |
mean |
Average residential unit value ($) |
mean |
Total residential units accessible within 3 km |
mean |
Total jobs accessible within 5 km along the auto street network (natural log) |
mean |
Vacant residential units |
sum |
Vacant employment spaces |
sum |
Average residential unit rent within 5 km |
mean |
Average household annual income within 3 km |
mean |
Total population accessible within 1.5 km |
mean |
Residential unit capacity |
sum |
Households per acre |
sum then normalize |
Jobs per acre |
sum then normalize |
Residential units per acre |
sum then normalize |
Household mean income |
mean |
Household median income* |
median** |
Total household homeowners |
sum |
Total household renters |
sum |
Total workers |
sum |
Total population |
sum |
Mean household size* |
mean |
Total jobs by sector* |
sum |
Total households by annual household income range* |
sum |
Total persons by age range* |
sum |
*Only available as a chart or table export, not available as a map layer by default. **No spatial aggregation is computed, metric is computed directly on agents inside of each geography level.
Parcel and Zone model example layers
Parcel and zone model indicators can be fully customized depending on the customization of your model system and the data utilized.