User Interface
User Interface and Menus
UrbanCanvas User Roles
On the left hand side of the UrbanCanvas user interface header you will see your current user role associated with the region you are viewing which can be either UrbanCanvas Modeler or Viewer. UrbanCanvas Modeler and Viewer have identical user interfaces, however the user interface for Viewer can vary depending on your account administrator’s permission settings. Default Viewer permissions allow for Viewer users to view a customized list of map layers and allow Viewer users to use the comments feature. The chart dashboard can also be configured for use by viewers. For more on UrbanSim user accounts and user roles see the settings and accounts section for more information.
UrbanCanvas Regions
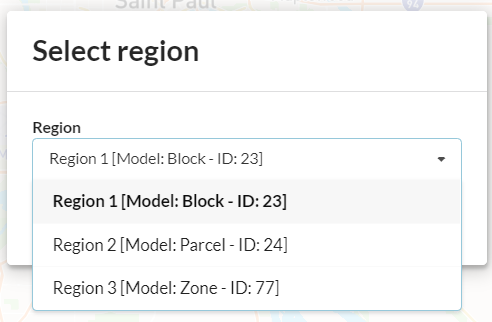
The name of the region that you are currently viewing is displayed on the right hand side of the UrbanCanvas user interface header next to your username. An UrbanCanvas region is a distinct UrbanCanvas instance with its own database and set of users. You can view basic metadata about the region by placing your mouse over the region name. This information includes the region’s: UrbanSim model template type, local spatial reference system (SRS), UrbanSim unique region identifier, and UrbanSim model base year. If you have access to more than one UrbanCanvas region, you can easily switch between different regions in your account by clicking on the region name in the UrbanCanvas header to bring up the region selection window. Then choose from a list of regions to switch to. Changes to any of the information displayed for your region can be requested by your account admin by contacting us here. For more on UrbanSim user accounts and UrbanCanvas regions see the settings and accounts section for more information.
UrbanCanvas Menus
On the right hand side of the UrbanCanvas user interface header, you will find icons to access comments ![]() and chart dashboards
and chart dashboards ![]() . You will also find the Uploads button to access the uploads page to upload and edit files. UrbanCanvas Viewers may or may not have these features enabled. Feature permissions are determined by your account administrator.
. You will also find the Uploads button to access the uploads page to upload and edit files. UrbanCanvas Viewers may or may not have these features enabled. Feature permissions are determined by your account administrator.
Also on the right hand side of the UrbanCanvas user interface header you will find your UrbanSim username. Clicking on your username will reveal a dropdown menu with the following options:
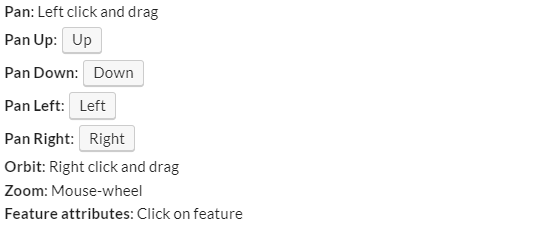
Controls: view keyboard shortcuts and mouse controls.
Manage Settings: access UrbanSim account settings including: - Your profile: view and edit your UrbanSim user profile. - Your subscription: view your UrbanCanvas subscription and account usage and limits tied to your region. - Your Account Users (available to admins only): view users in your account that are tied to your region, change their UrbanCanvas role, and invite new users or remove users from your region. - Your permissions: view your role permissions or for admins change permissions for user roles to access specific UrbanCanvas features or data.
Help: access the UrbanCanvas help system and shortcuts to report a issue or to submit feedback.
About: view your current UrbanCanvas release version number and links to UrbanSim’s privacy and terms of use polices.
UrbanSim: shortcut to go to the UrbanSim website
Logout: click to logout of UrbanCanvas
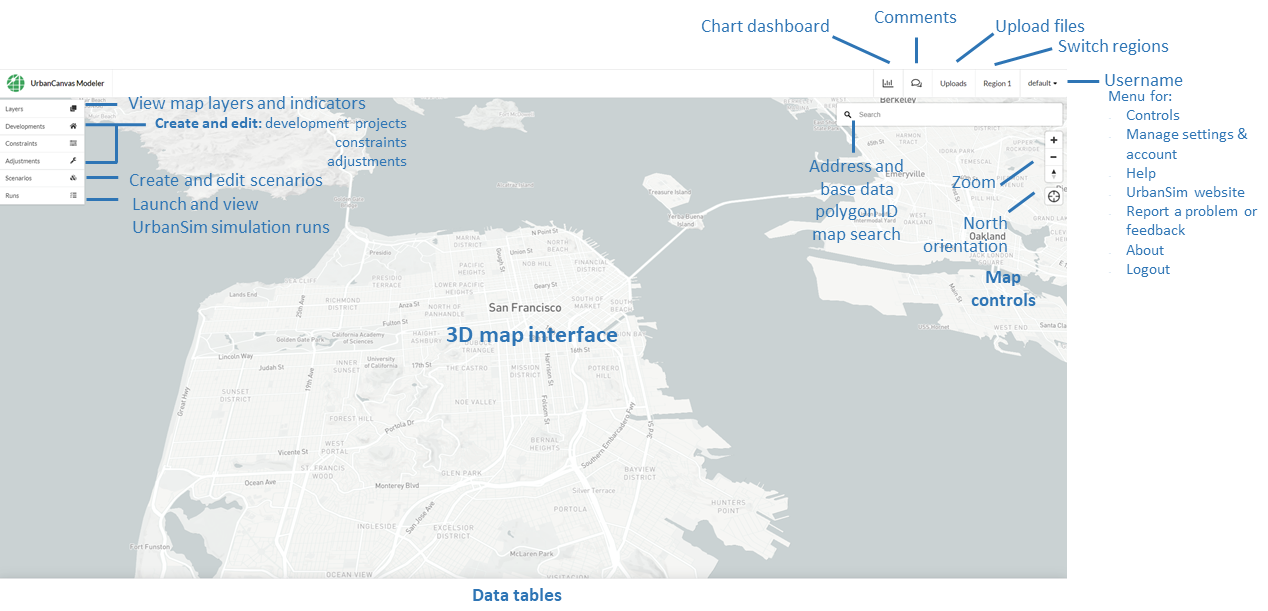
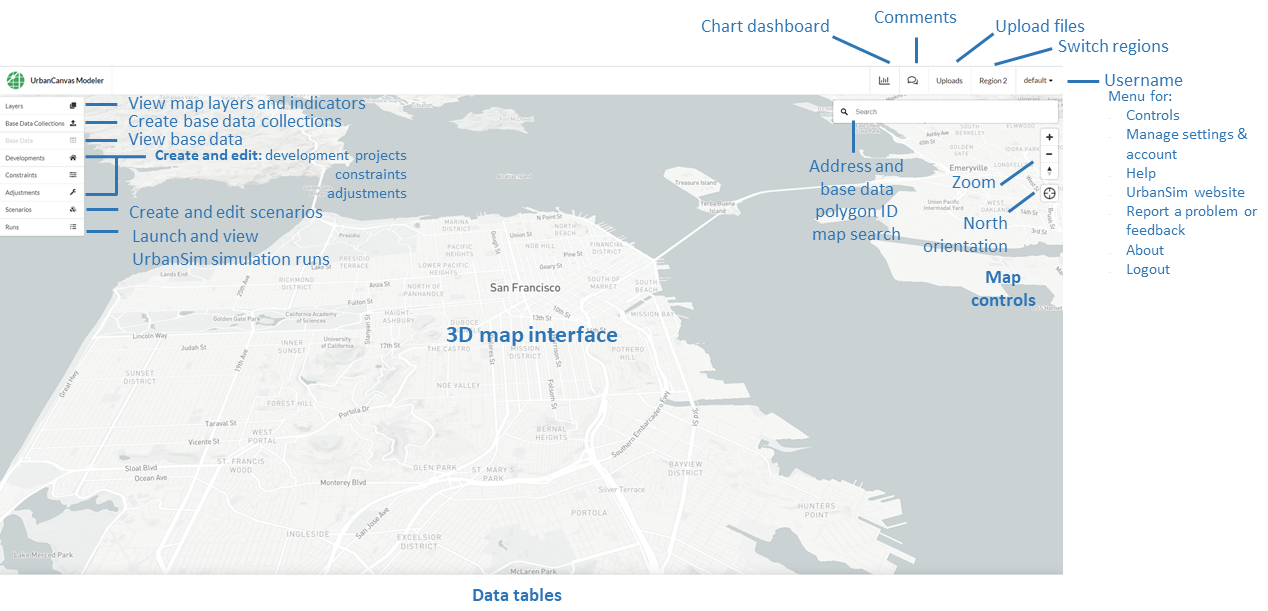
On the left hand side of UrbanCanvas is the main menu. Depending on your UrbanCanvas role (e.g. Modeler or Viewer), this menu holds all the tools needed to visualize data on the map, create and edit tags, create and edit development projects, constraints, adjustments, and scenarios and launch simulations. When creating or editing a development project, constraint, adjustment, and scenario or when launching simulation runs, saved records can be viewed in the table on the bottom of the user interface when you click on the respective menu button. The location of existing development projects, constraints, and adjustments will appear on the map when you click on the respective menu button or these data can be viewed separately in the layers menu. UrbanCanvas Viewer may or may not have these features enabled. Feature permissions are determined by your account administrator. By default the main menu for UrbanCanvas Viewer will have all the tools needed to visualize data on the map. For more on map layers including symbology, 3D extrusion, and the time slider see here.
Please note that the last location and zoom level you used on the map and the layers with symbology settings you had in your layers panel before you logged out will persist between your login and log out sessions and are tied to your username. For this reason it is important that all users in your account have individual user accounts to use UrbanCanvas. Account administrators can invite new users to UrbanCanvas at any time. See the settings and accounts section for more information.
Block and zone model interface:
Parcel model interface:
Map Navigation Tools
Map navigation is designed to operate via the buttons at top right of the user interface or using a standard three-button mouse. You can use the crosshair button to return to your region’s default center location. This default location can be changed at anytime by your account admin by sending us a request here.
Mouse Navigation
Viewing Attributes of Features on the Map
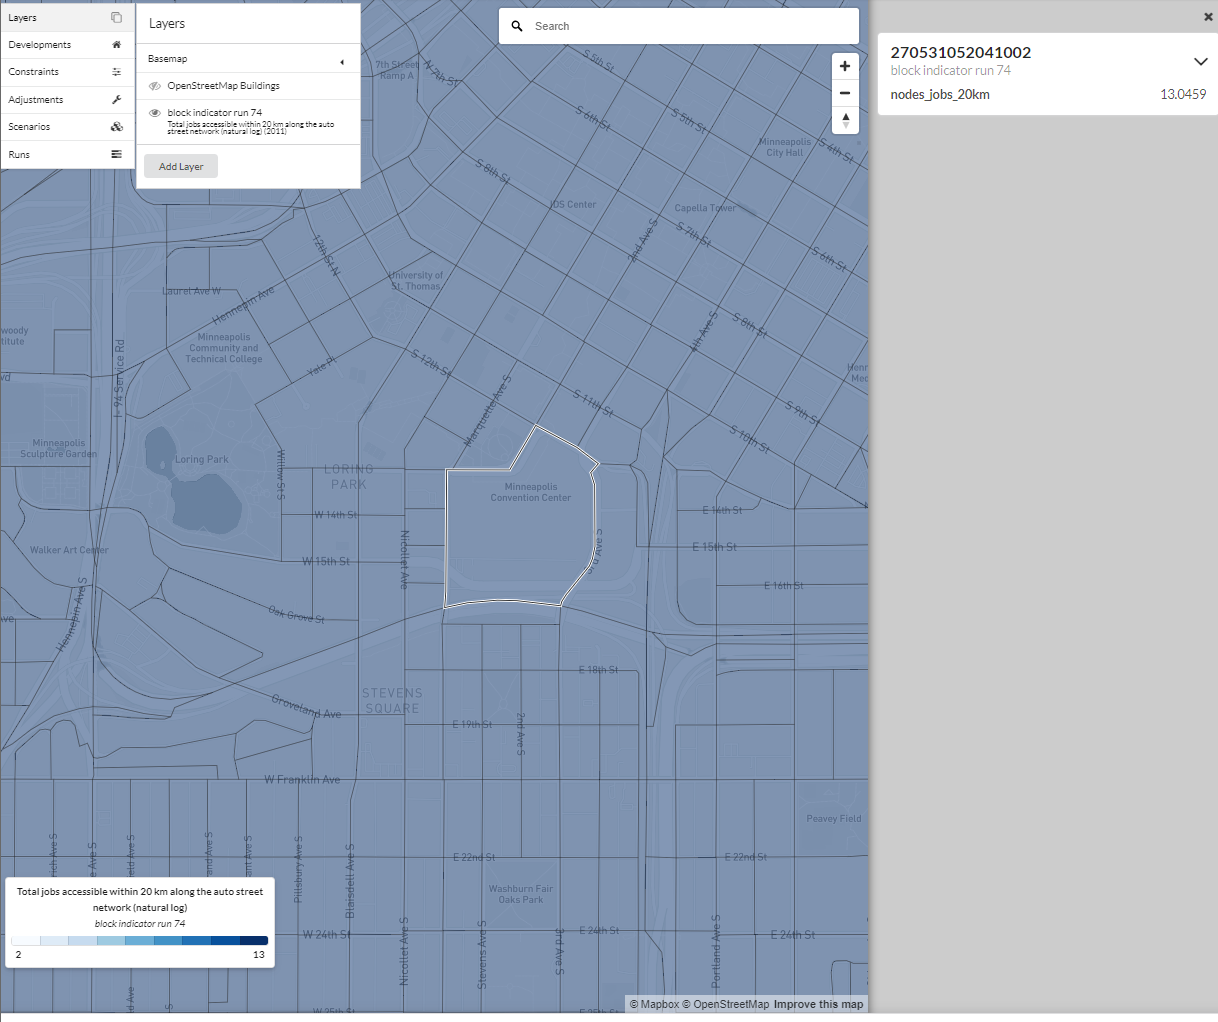
When map layers are displayed on the map, you can view the attributes of any feature that intersects your mouse by left clicking on the feature on the map. An attribute table will open on the right hand side of the map to display attributes for each feature displayed on the map at that location.
Selection Tools
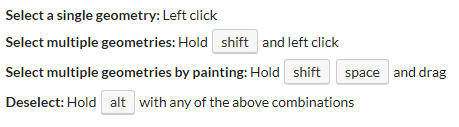
Selection Shortcuts
Selection is enabled using a single-click method. To select multiple polygons you may hold down shift and continue to select polygons or can hold down shift + space to paint a selection with the mouse cursor. To deselect polygons hold down alt or ctr and click on the polygon to remove from the selection. See the selection keyboard shortcuts below for more. In addition there is the Select by polygon tool, which includes several different overlay functions such as intersection, contain, and overlap to aid in the selection of multiple polygons over large areas. UrbanCanvas Viewer may or may not have these features enabled. Feature permissions are determined by your account administrator.
Map Search
You may search for addresses/place names and polygon IDs in your model base data by using the search function in the upper right hand side of the map.
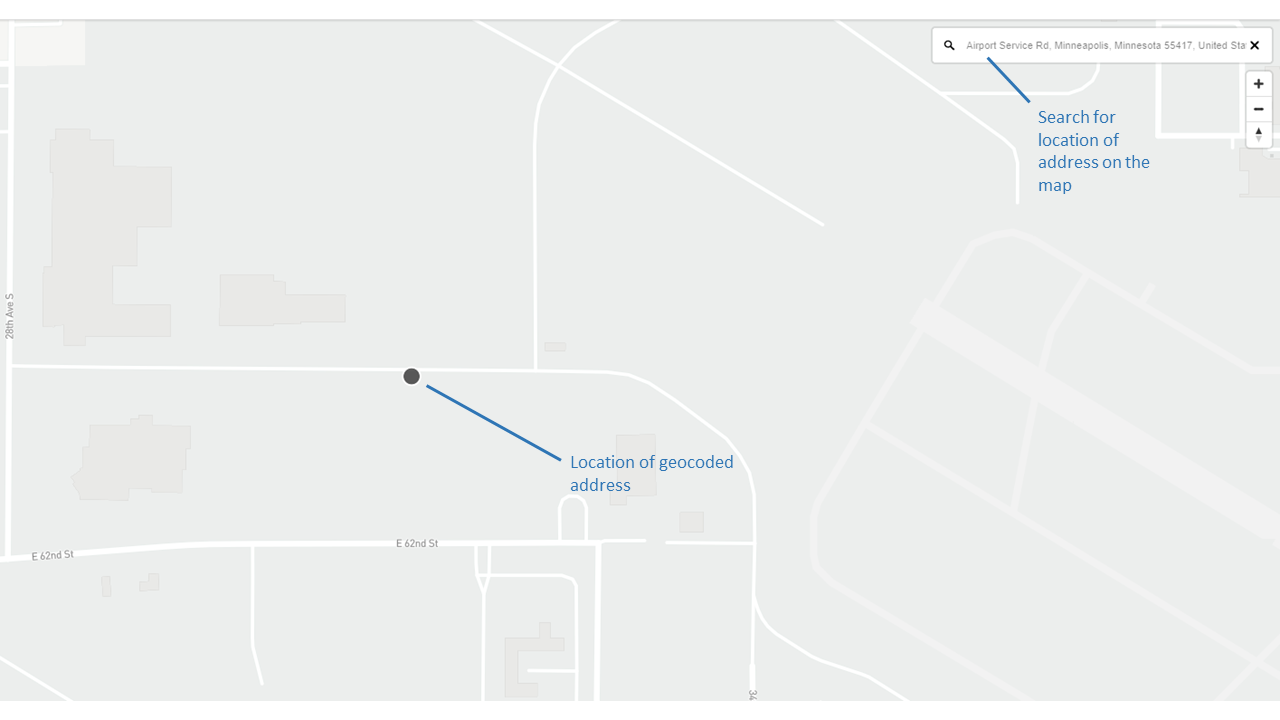
Address Search
You can type in an address or place name into the search bar (the address or place name will autocomplete as you type) and the map will pan to the found location. The location will appear as a dot on the map.
The address search uses the Mapbox geocoder. If you cannot find an address or find the location to be incorrect, you may report the error to Mapbox using their geocoder feedback tool here.
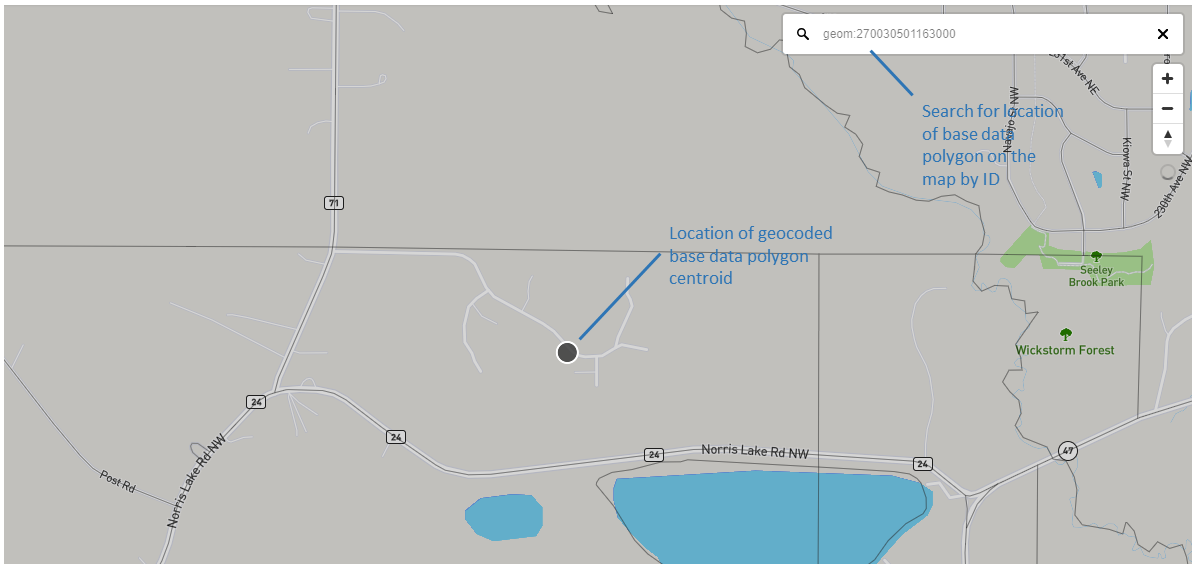
Base Data Geometry ID Search
Using the map search bar, initialize the search by typing geom: and then follow by typing the ID. The ID will autocomplete as you type and the map will pan to the found location. The location will appear as a dot on the map. Block model users can search for the location of a US Census block by typing in the block ID (FIPS code). Parcel model users can type in the primary ID of their uploaded parcel geometries. Zone model users can search for the location of a zone by typing in the zone ID.
Tables
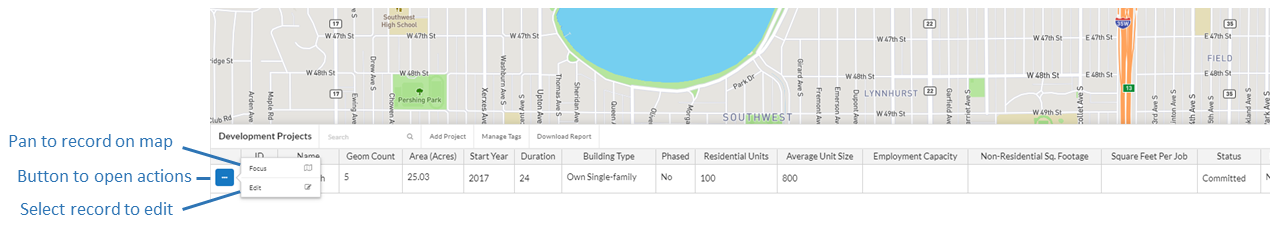
All tables in the user interface allow for column resizing, sorting, and search. Tables that have functions built into individual records have buttons that when clicked on reveal the actions that can be taken on the selected record - see the image below for an example.
Map and table filters
The data displayed on the map and in some tables can be filtered by using the filter feature and selecting the attribute you wish to apply the filter on and then a value or list of values the attribute must equal. Currently this is available for scenarios, development projects, constraints, and adjustments and you may filter based on tag or scenario name, if a scenario has been created that utilizes specific tags. For example, in the development projects tab you may want to view all development projects on the map that are utilized in a specific scenario or that have a specific set of tags. Chart records can also be filtered by tag. UrbanCanvas Viewer may or may not have these features enabled. Feature permissions are determined by your account administrator.
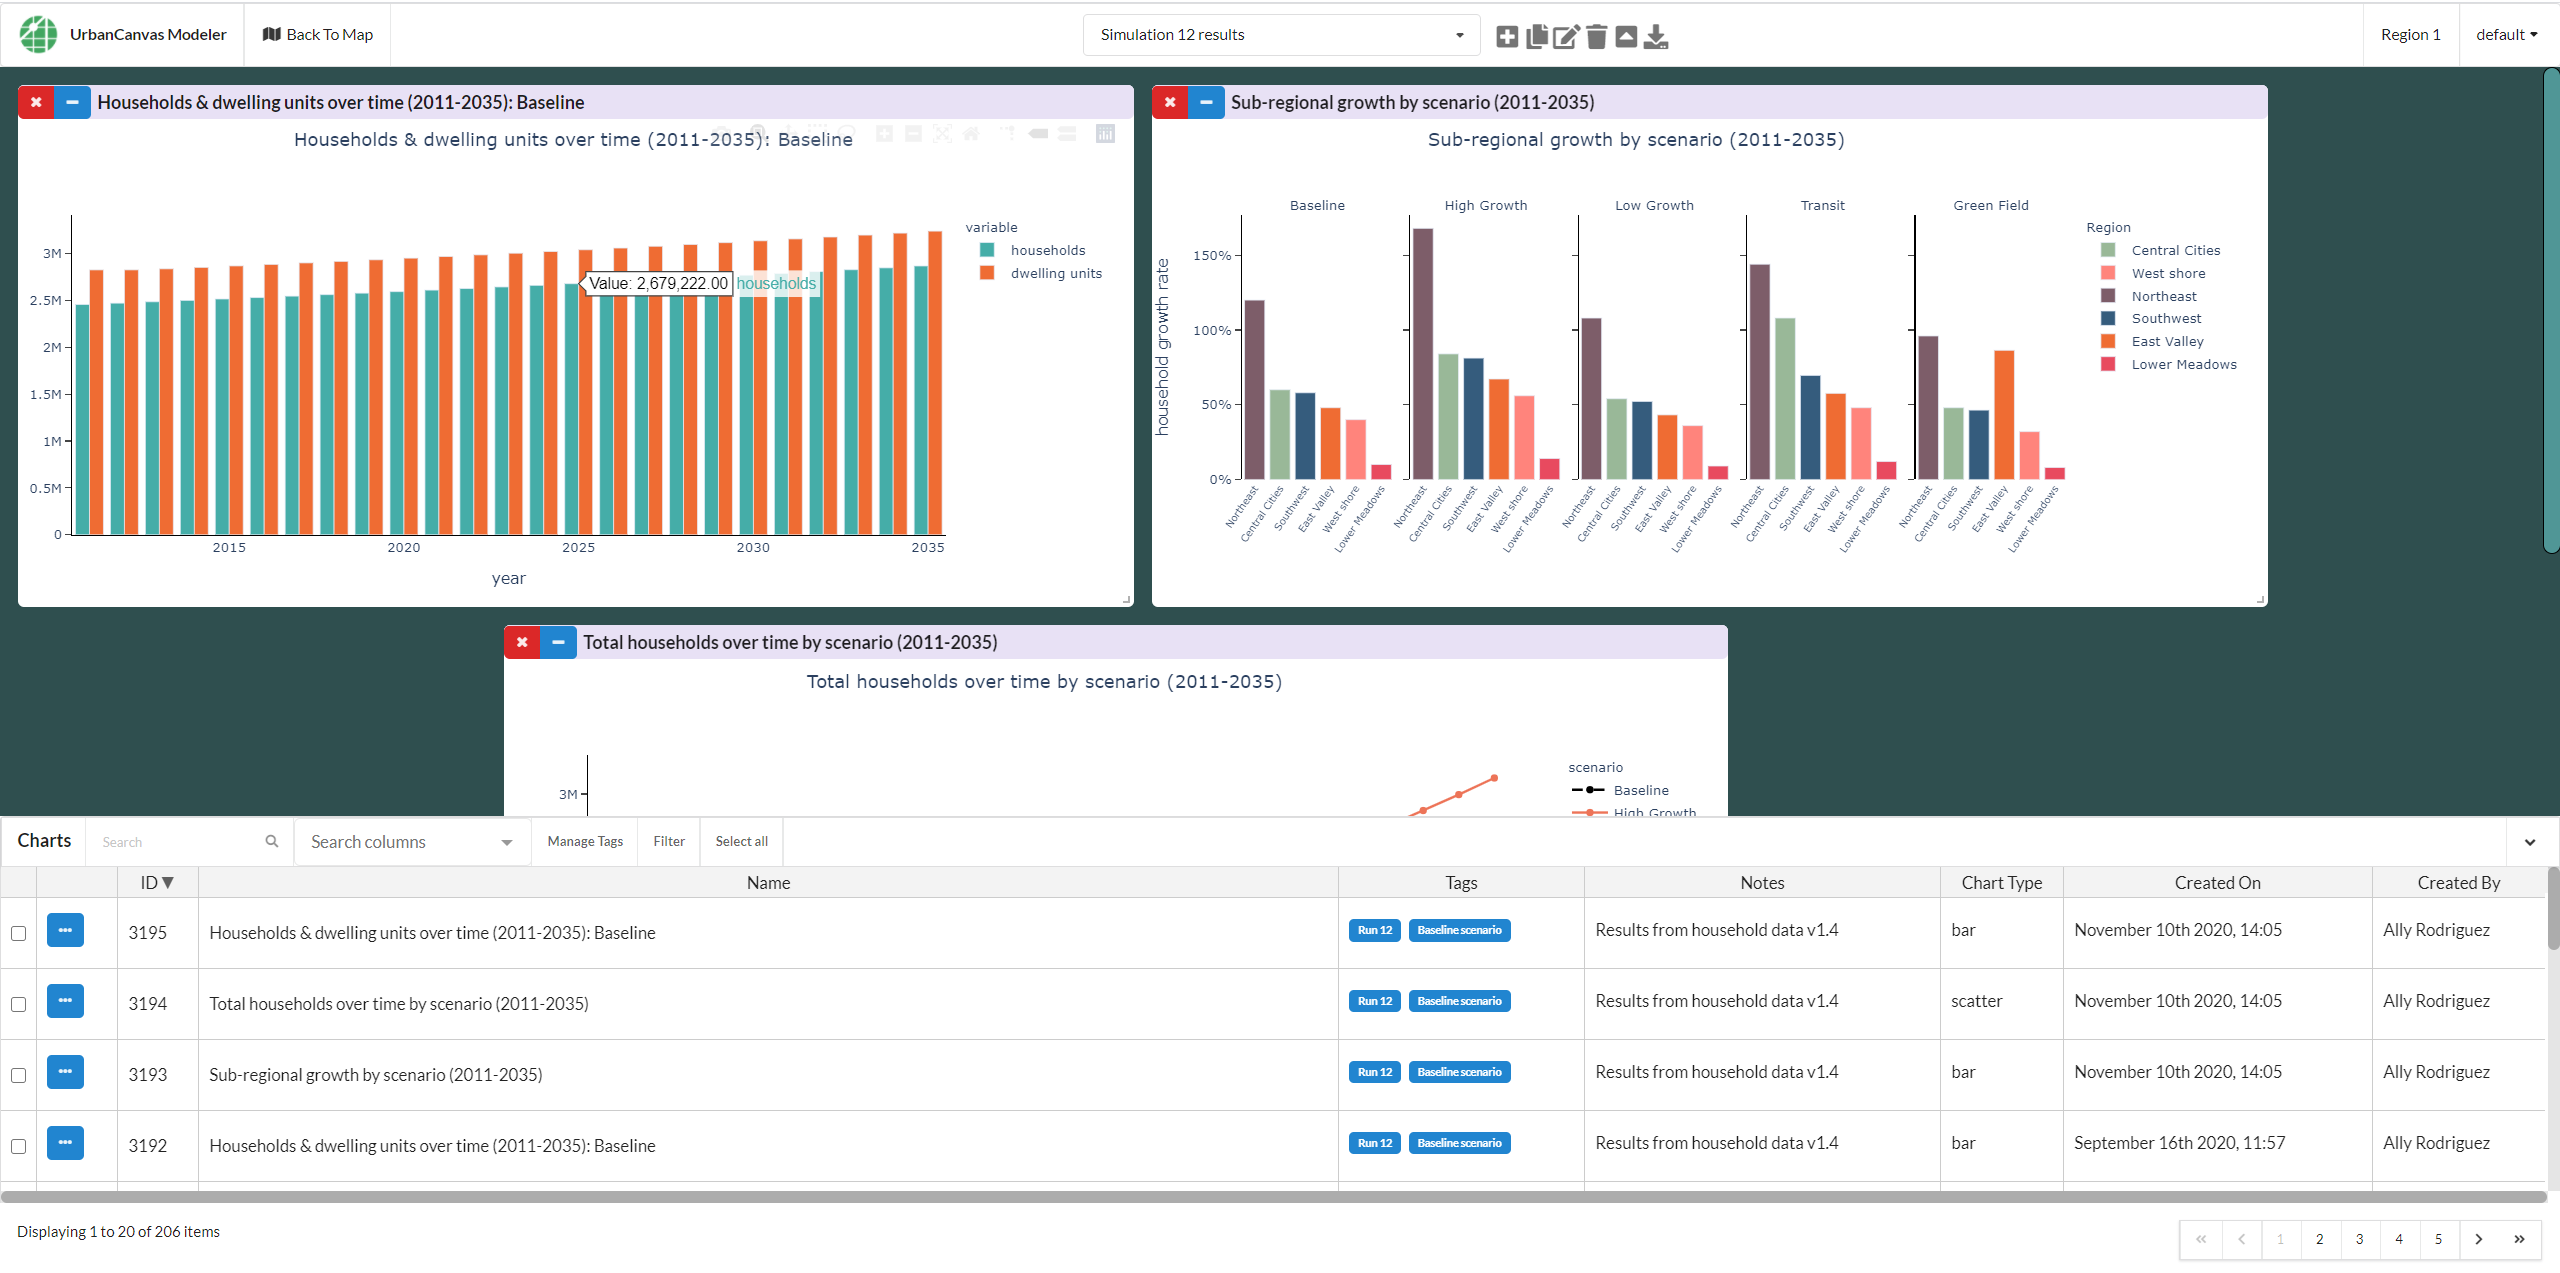
Chart dashboard interface
See the chart dashboard section for more information on the dashboard user interface. UrbanCanvas Viewer may or may not have this feature enabled. Feature permissions are determined by your account administrator.