General Data Uploads
General CSV
Arbitrary CSV files can be uploaded to UrbanCanvas and can be stored in your database. These files can be used to assist with consulting activities with UrbanSim or custom data requirements needed for a customized implementation of a UrbanSim model. There is no data schema for this upload.
General Shapefile
Arbitrary shapefiles of any geometry type (e.g. point, line, and polygon) can be uploaded to UrbanCanvas and can be stored in your database. These shapefiles can be visualized and queried as a map layer and can be used as a reference layer when examining model indicators or creating model data inputs or can be used as custom indicator layer geometries for uploaded indicators. These data can also be used to assist with consulting activities with UrbanSim or custom data requirements needed for a customized implementation of a UrbanSim model. There is no data schema for this upload, the upload should be in the form of a zipped (.zip) shapefile.
Transportation Networks
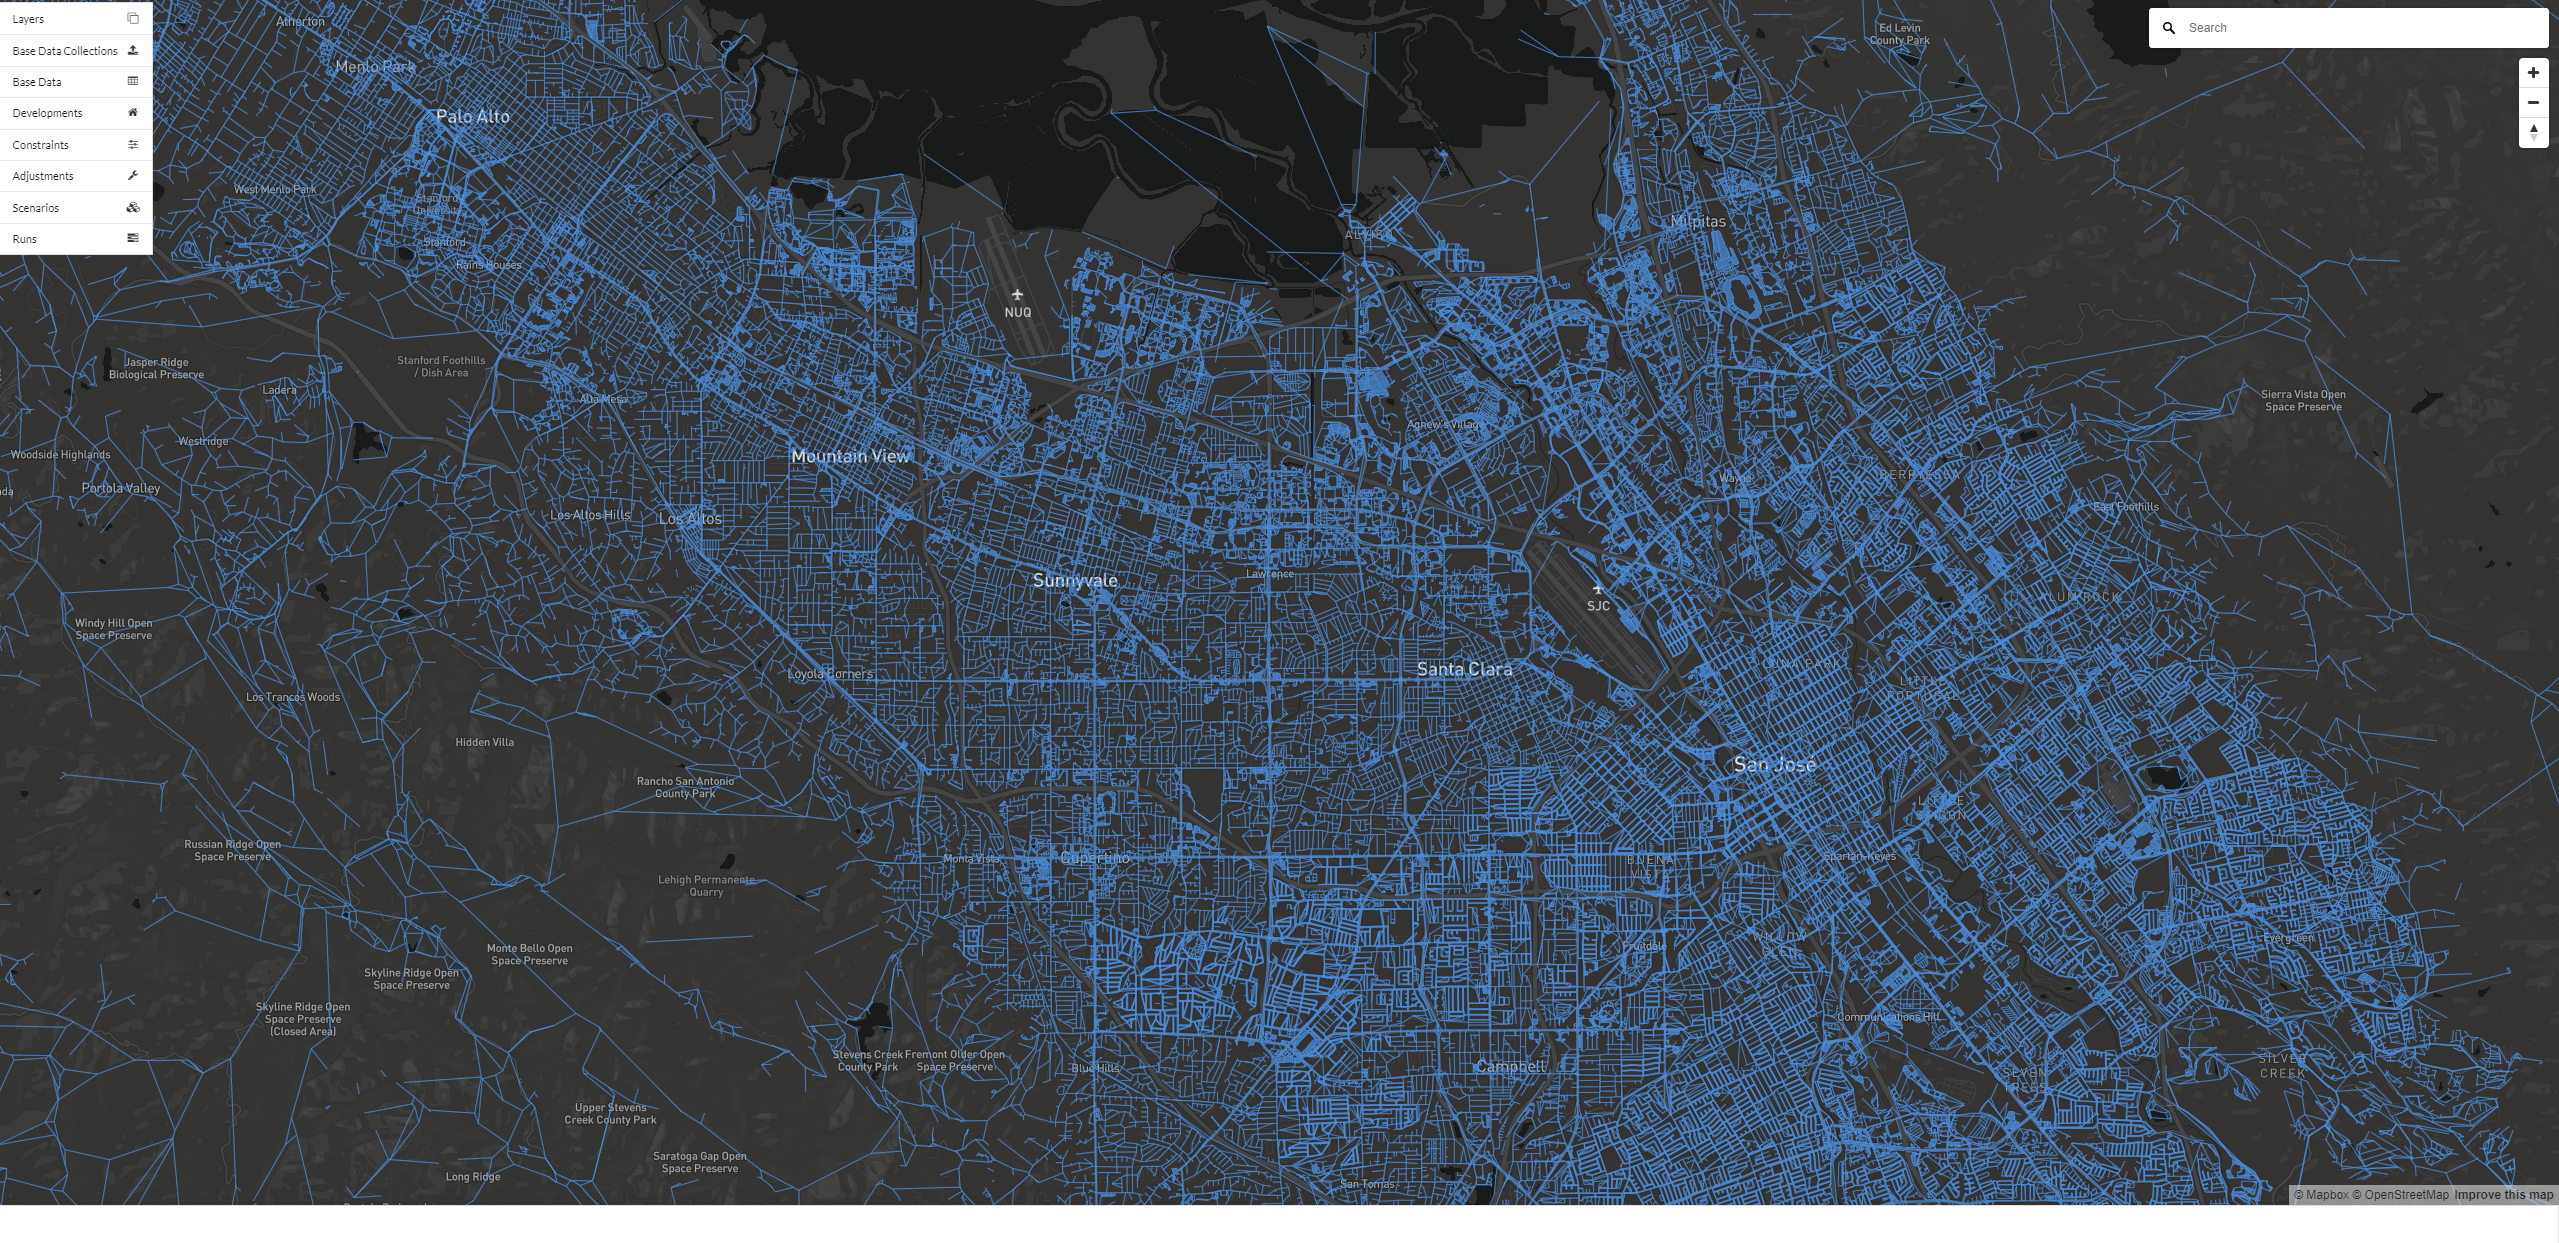
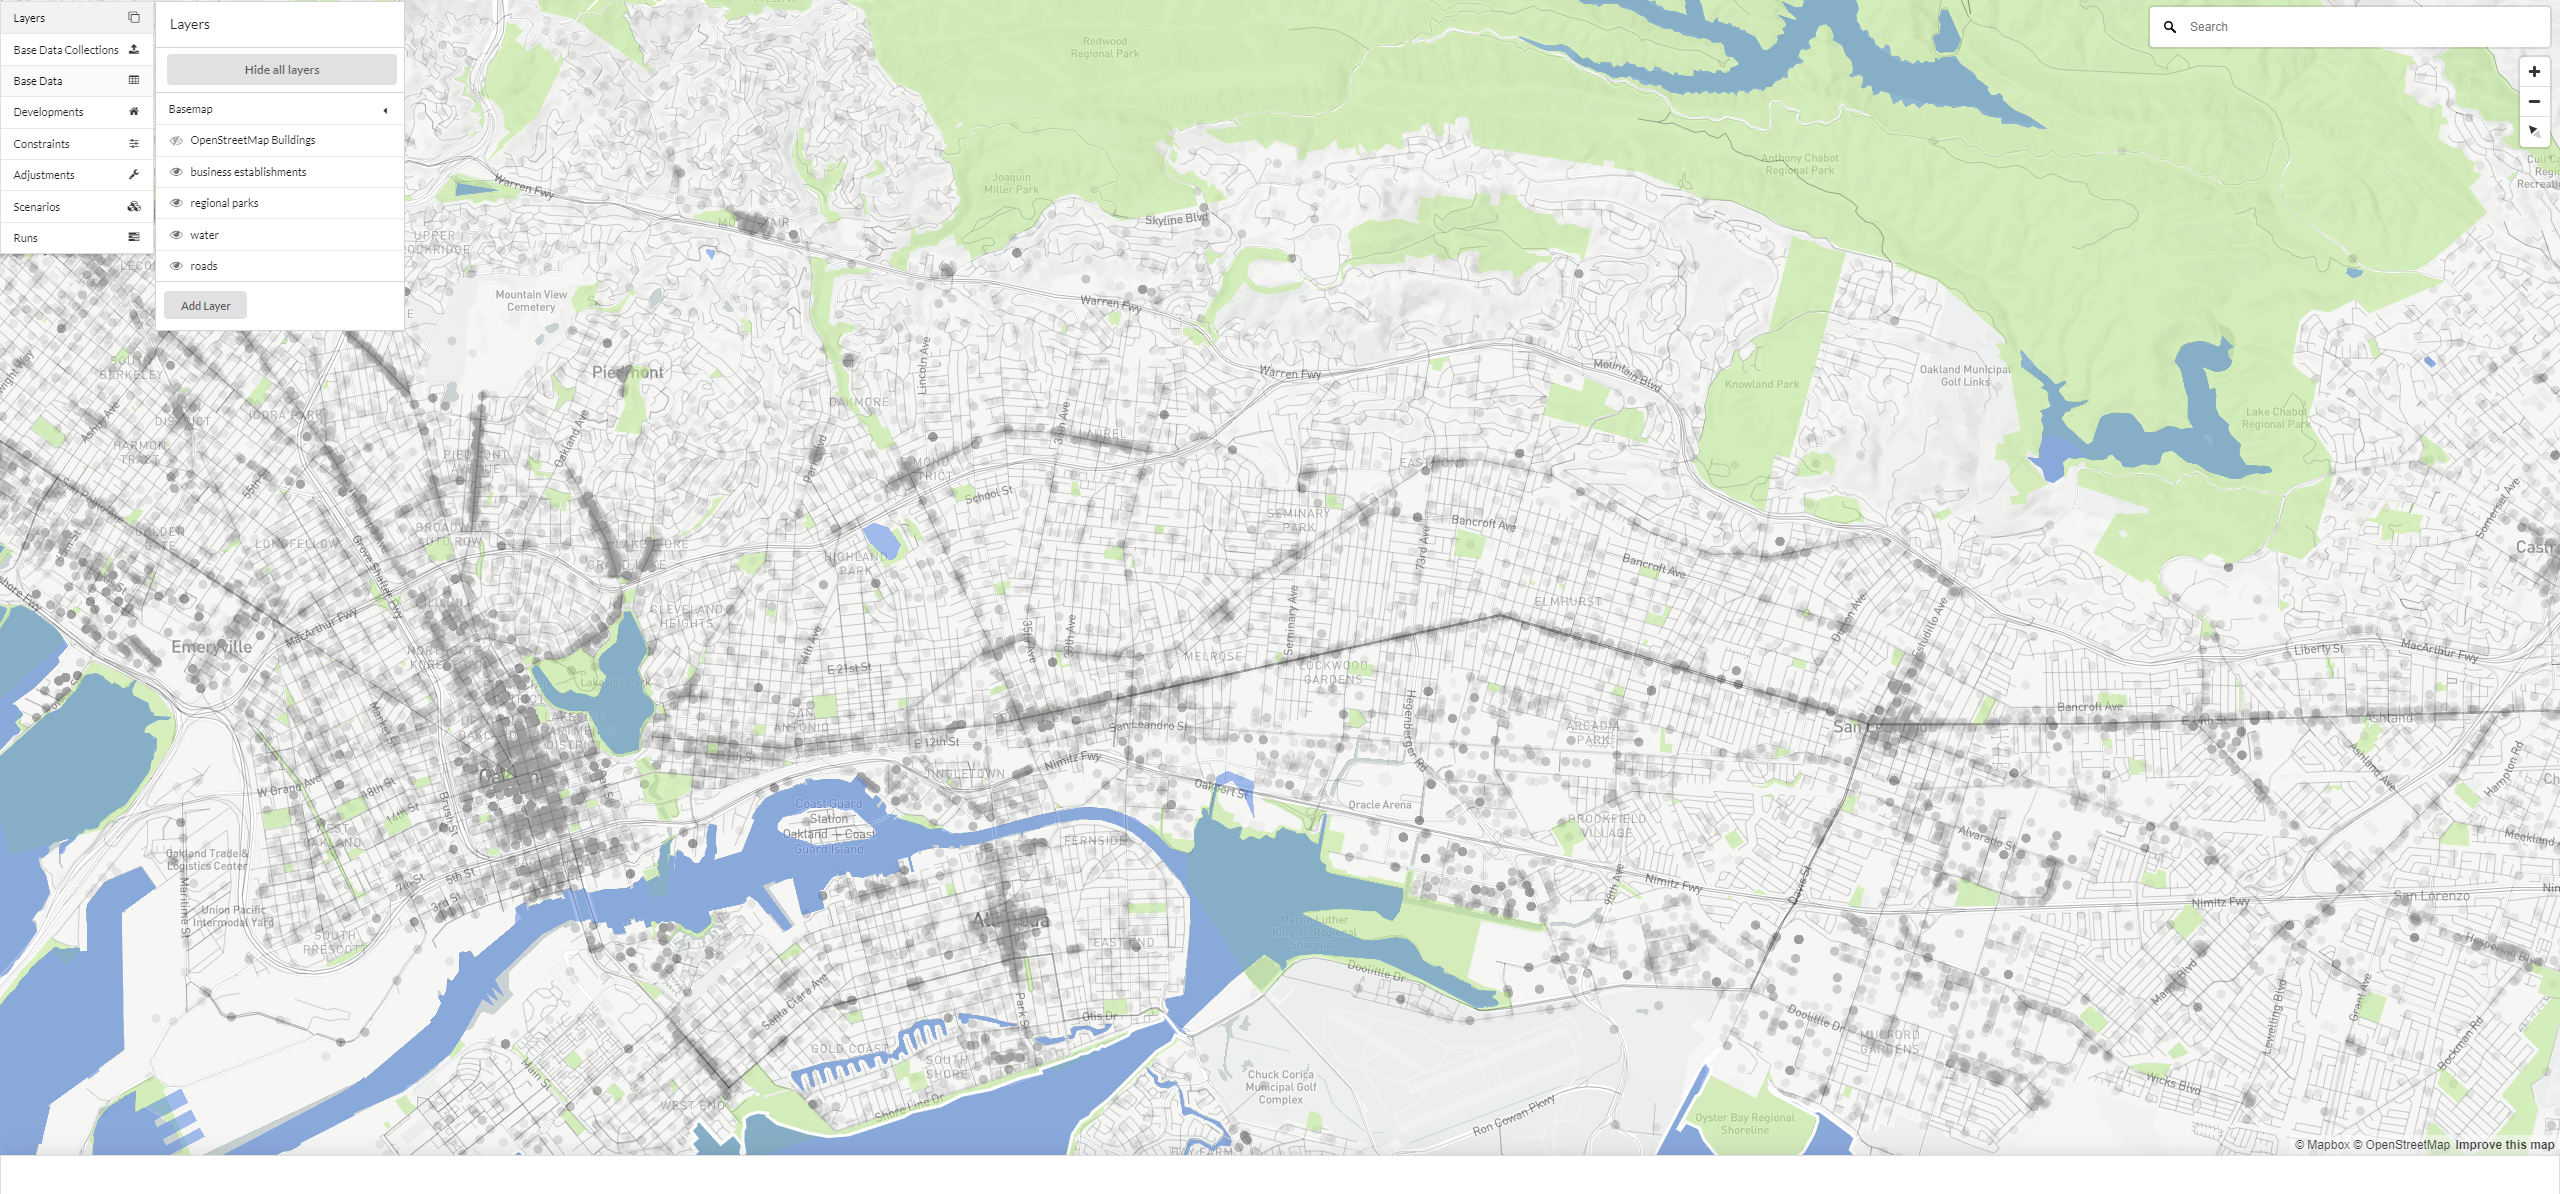
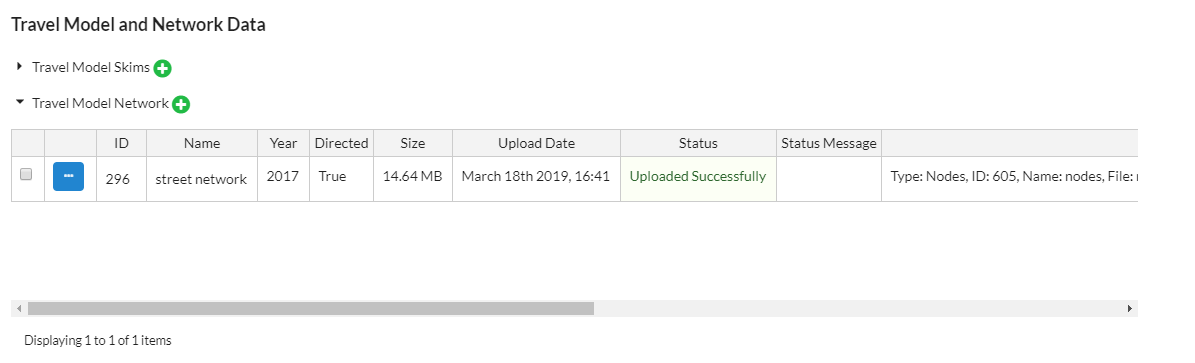
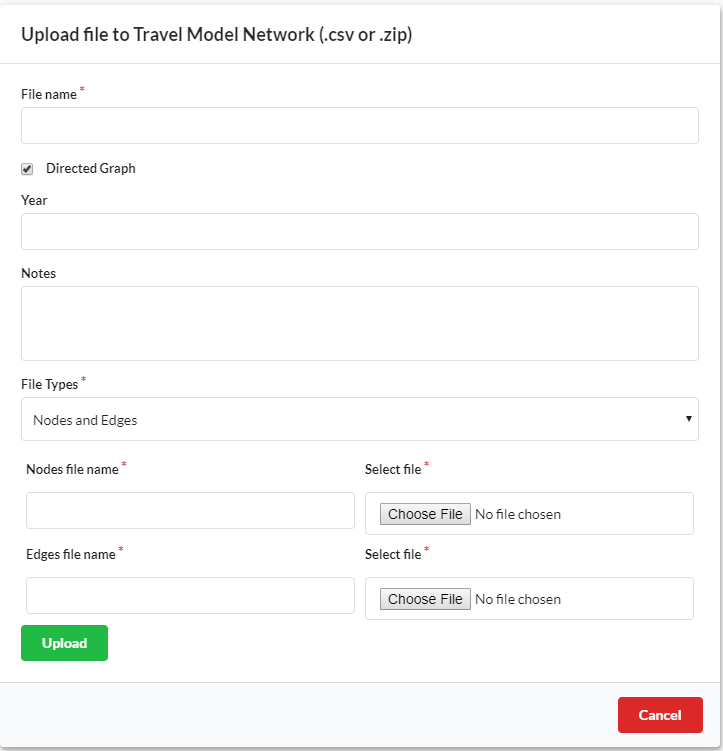
Under the travel model and network data upload section, the travel model network uploader supports the upload of custom transportation networks. Uploaded networks can be visualized and queried on the map for reference or can be requested to be used in your UrbanSim model in place of the default networks UrbanSim provides by contacting us here. Networks can be of any type as long as the network graph or shapefile data schema is followed and can include but are not limited to: travel model networks, automobile, pedestrian, or transit networks. Both directed and undirected transportation networks are supported in the following formats: 1) graph network (e.g. node and edge CSV tables); 2) network geometry as a shapefile; and 3) a combination of 1 and 2 combination of 1 and 2 with a graph network together with its corresponding network geometry as a shapefile. Upon upload, network files are post-processed such that the resulting data will be readily available to be used in UrbanSim and transportation network and accessibility analyses. Network shapefile uploads will automatically be processed into the node and edge components of a graph network. The original shapefile geometry and the resulting nodes and edges are saved to the database and are available for viewing on the map. The three supported network upload formats and data schemas are described below here.
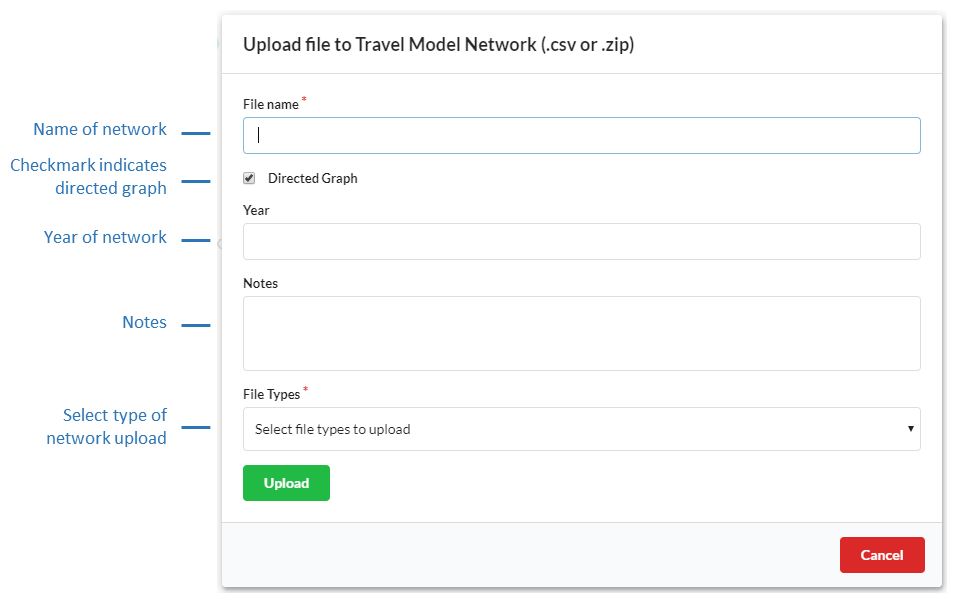
File Name (Required)
The name of the network should be distinct.
Directed Graph (Required)
Indicator as to whether or not the uploaded network is directed or undirected. Default check mark is set to True to indicate a directed graph. Note: directed graphs require indication of direction with a oneway boolean column where 1 = oneway and 0 = twoway travel.
Year (Optional)
The year that the network data represents.
Notes (Optional)
Notes can be added to include any other pertinent information for greater context.
File Types (Required)
The type of network you are uploading: 1) Nodes and Edges: Graph network; 2) Geography: Shapefile network geometry; 3) Both: Combined network graph and geometry.
Network graph
The Nodes and Edges network type is a graph representation of a transportation network comprised of network nodes (network vertices) and edges (network links connecting nodes). These tables can be uploaded independently as CSVs following the data schema below. Graph representations of transportation networks are designed to describe the geographic location of network vertices and the attributes of the links that connect them. Edges (e.g. links) can be directed (e.g. travel direction is explicitly designated between nodes) or undirected (e.g. travel direction is assumed to occur in both directions between nodes). Edges also have attributes that describe the relative cost or ease of travel between nodes using an impedance or friction factor such as distance, travel time, or a utility coefficient. Typically transportation network graphs represent network geography in a simplified manner where only the nodes represent the geographic location of infrastructure and the line geometry of network links are not preserved. However, the network uploader also offers the Both network upload option which enables uploads of nodes and edges together with the network line geometry as a shapefile. See the both network type section below for more information. Node and edge uploads are uploaded as is to the database and are transformed into spatial layers for visualization on the map.
Nodes
Nodes represent network vertices such as street or path intersections or transportation terminals such as transit stops and stations. The nodes table must have a node_id column populated with unique identification numbers that correspond to the identifiers in the from_id and to_id columns in the edges table. All node identification numbers in the nodes table node_id column must be accounted for in the edges table from_id or to_id columns. The nodes table also holds the latitude and longitude geographic location of nodes in x and y columns. The node table data schema can be found below:
Column Name |
Data Type |
Required |
Description |
|---|---|---|---|
node_id |
Integer |
Yes |
Unique node identification number that |
x |
Float |
Yes |
Longitude coordinate of node location. Coordinates |
y |
Float |
Yes |
Latitude coordinate of node location. Coordinates |
Edges
Edges represent the links or connections between nodes such as streets, paths, or transit routes. The edges table must have a edge_id column populated with unique identification numbers and from_id and to_id columns populated with the corresponding node_id identification numbers from the nodes table. All node identification numbers in the from_id and to_id columns must exist in the nodes table node_id column. The edges table can have any number of custom named columns that hold the relative cost or ease of travel along the edge using an impedance or friction factor such as distance, travel time, or a utility coefficient as a float. If the edges represent a directed graph, oneway travel direction is explicitly designated between the from_id and the to_id columns. If the edges represent an undirected graph, twoway travel is assumed to occur between the from_id and the to_id columns. Graphs can optionally have a oneway column that explicitly designates each edge as accommodating oneway (1 = oneway) or twoway travel (0 = twoway), however this is not required. The edge table data schema can be found below:
Column Name |
Data Type |
Required |
Description |
|---|---|---|---|
edge_id |
Integer |
Yes |
Unique edge identification number. |
from_id |
Integer |
Yes |
Node identification number that corresponds |
to_id |
Integer |
Yes |
Node identification number that corresponds to the |
[ARBITRARY_COL_NAME] |
Float |
Yes |
Any number of columns with any arbitrary |
oneway |
Boolean |
No |
Indicator of direction where |
Note
If this is a directed graph, travel direction is indicated using the from_id to the to_id. It is optional to also include the boolean oneway column indicating oneway and twoway edges.
Examples of node and edge (directed and undirected graph) CSVs:
node_id |
x |
y |
|---|---|---|
1 |
-122.419423 |
37.792587 |
2 |
-122.419253 |
37.791708 |
3 |
-122.419097 |
37.790959 |
4 |
-122.421419 |
37.794141 |
edge_id |
from_id |
to_id |
distance |
|---|---|---|---|
1 |
1 |
2 |
10 |
2 |
2 |
3 |
12 |
3 |
3 |
4 |
8 |
Where: edge_id 1 travel direction is assumed to be twoway between nodes 1->2 and 2->1.
Where: edge_id 2 travel direction is assumed to be twoway between nodes 2->3 and 3->2.
Where: edge_id 3 travel direction is assumed to be twoway between nodes 3->4 and 4->3.
edge_id |
from_id |
to_id |
oneway |
distance |
|---|---|---|---|---|
1 |
1 |
2 |
0 |
8 |
2 |
2 |
3 |
1 |
11 |
3 |
3 |
2 |
1 |
11 |
4 |
3 |
4 |
1 |
50 |
Where: edge_id 1 with `oneway`=False indicating its a twoway direction edge between nodes 1->2 and 2->1.
Where: edge_id 2 with `oneway`=True indicating its a oneway direction edge between nodes 2->3.
Where: edge_id 3 with `oneway`=True indicating its a oneway direction edge between nodes 3->2.
Where: edge_id 4 with `oneway`=True indicating its a oneway direction edge between nodes 3->4.
Note
No additional processing occurs on the node and edge tables, they are uploaded as is.
Network geometry
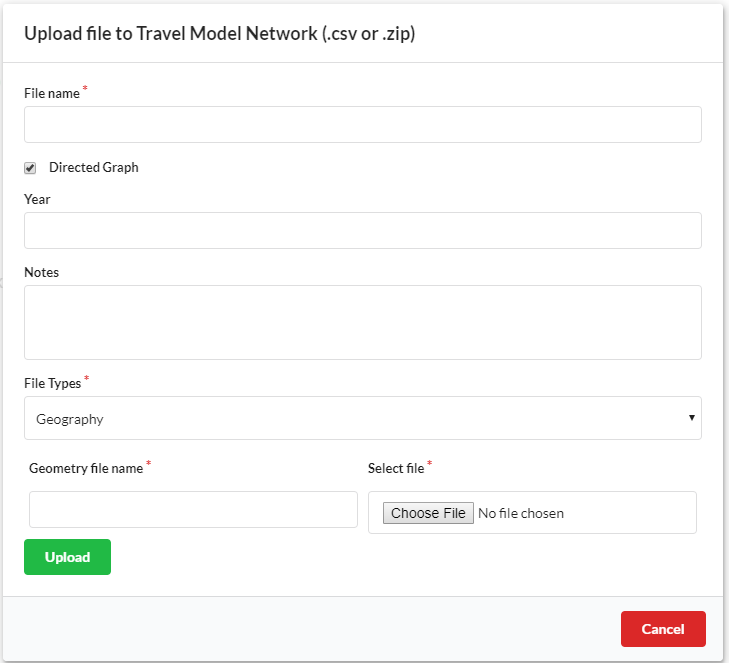
The Geography network type is a shapefile of line geometries that represent a transportation network. Each record in the shapefile represents the geometry of a single network link. The shapefile can have any number of custom named columns that hold the relative cost or ease of travel along the link using an impedance or friction factor such as distance, travel time, or a utility coefficient as a float. Upon upload, the shapefile is converted into a directed or undirected graph, depending on the option checked in the upload form. The resulting graph will be a format that can be readily used by UrbanSim for network and accessibility analyses. The node and edge components of the graph network that are generated as well as the raw geometry uploaded in the shapefile are made available to view as a spatial layer in the map.
Checking the check box to designate a shapefile as a directed graph will result in a directed graph edge table where travel direction is indicated using the direction implied by the order of the vertices that make up the line geometry of a single link with the required oneway column indicating if travel direction occurs in one or two directions along the link (1 = oneway) or twoway travel (0 = twoway). If the shapefile is a undirected graph all links will be assumed to allow twoway travel.
The upload should be in the form of a zipped (.zip) shapefile. The data schema can be found below:
Column Name |
Data Type |
Required |
Description |
|---|---|---|---|
link_id |
Integer |
Yes |
Unique link identification number. |
[ARBITRARY_COL_NAME] |
Float |
Yes |
Any number of columns with any arbitrary |
oneway |
Boolean |
No - Required only |
Required for directed graphs. Indicator of |
Note
If this is a directed graph, travel direction is indicated using the direction implied by the order of the vertices that make up the line geometry of a single link with oneway indicating oneway and twoway links.
An example of the process used to convert a directed line network shapefile into a graph network is below:
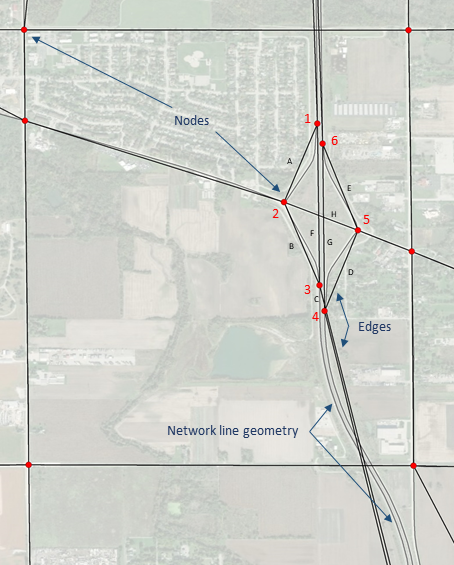
The network geometry shapefile lines in grey represent a typical highway interchange with on and off ramps (with oneway travel) and a connector road with a overpass (with twoway travel). The shapefile is converted to nodes in red and edges in black. An example of what the attributes of the resulting node and edge tables would look like are below:
Input: directed network as a shapefile
link_id |
oneway |
travel_time |
|---|---|---|
A |
1 |
0.4 |
B |
1 |
0.6 |
C |
1 |
0.1 |
D |
1 |
0.6 |
E |
1 |
0.4 |
F |
1 |
0.9 |
G |
1 |
1 |
H |
0 |
0.5 |
Output: Nodes
node_id |
x |
y |
|---|---|---|
1 |
-87.5820 |
41.5370 |
2 |
-87.5330 |
41.5330 |
3 |
-87.5820 |
41.5290 |
4 |
-87.5822 |
41.5280 |
5 |
-87.5800 |
41.5320 |
6 |
-87.5820 |
41.5360 |
Output: Edges
link_id |
edge_id |
from_id |
to_id |
travel_time |
|---|---|---|---|---|
A |
1 |
1 |
2 |
0.4 |
B |
2 |
2 |
3 |
0.6 |
C |
3 |
3 |
4 |
0.1 |
D |
4 |
4 |
5 |
0.6 |
E |
5 |
5 |
6 |
0.4 |
F |
6 |
1 |
3 |
0.9 |
G |
7 |
4 |
6 |
1 |
H |
8 |
2 |
5 |
0.5 |
H |
9 |
5 |
2 |
0.5 |
Both
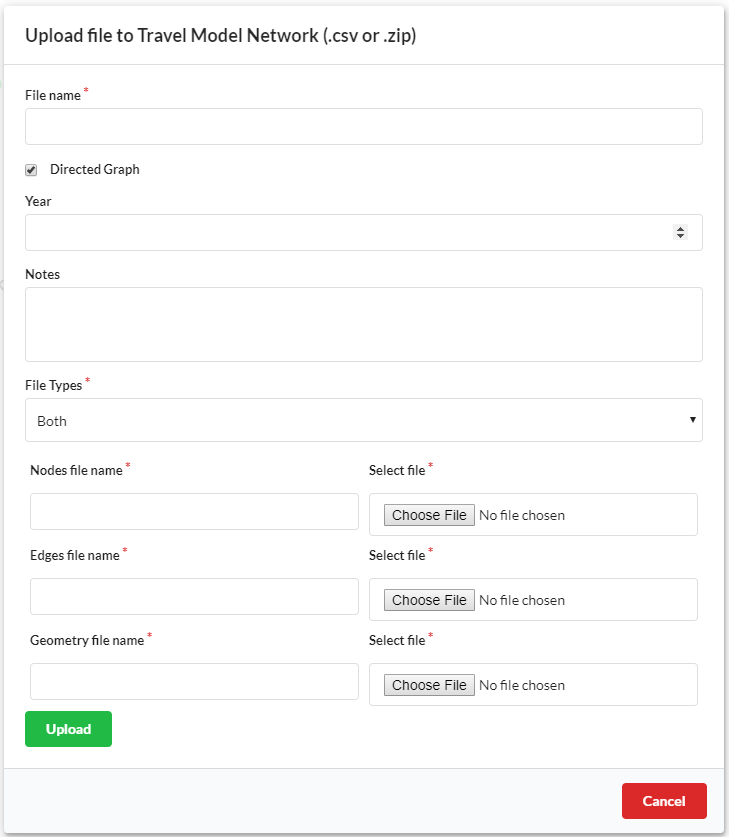
The Both network type allows for both the upload of graph network node and edge components as well as the underlying network line geometry that the graph network is based on. This combined upload is offered as a convenience for users who already have a graph network but wish to view the geometry of the network along with the simplified graph network geometry. For each upload, see the corresponding section above for details on the data schemas required.
Base Data Uploads
Rents and Prices
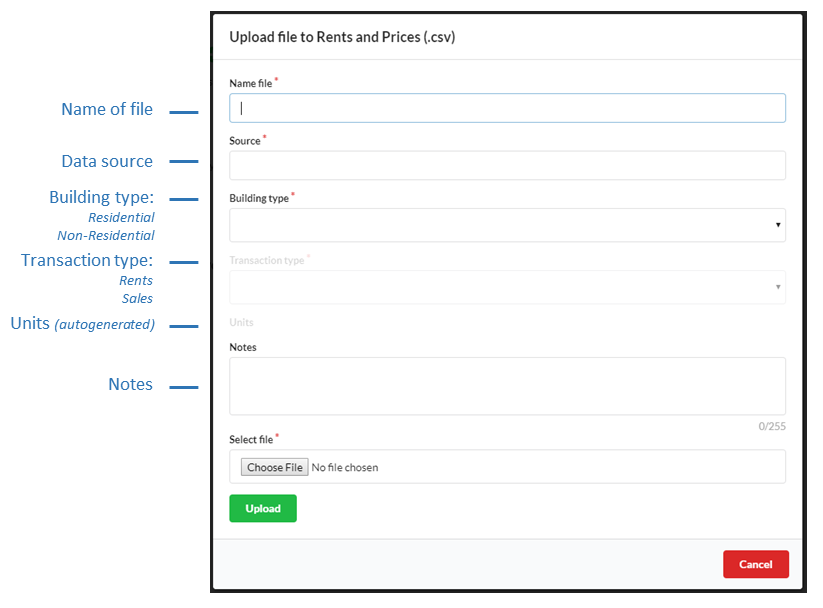
When uploading rent and price data as part of your model base data you may use the rent and price transaction data uploader in the base data uploads section. The upload form accepts the following inputs:
Name file (Required)
The name of the rents and prices data should be distinct.
Source (Required)
The source of the data (e.g. Costar) with other pertinent supporting information such as data year range.
Building type (Required)
The type of building the transaction data represents: 1) Residential; 2) Non-Residential
Transaction type (Required)
The type of transaction the data represents: 1) Rents; 2) Sales
Units
The unit of the transaction are autogenerated based on the building and transaction type you have specified where valid units are: 1) Residential rents: per unit per month; 2) Residential sales: per unit; 3) Non-residential rents: per SQFT; 4) Non-residential sales: per SQFT per year. Valid transactions must represent one of these unit types.
Notes (Optional)
Notes can be added to include any other pertinent information for greater context.
Data schemas for each building and transaction type can be found under each model type data schema page:
Time series indicators
Arbitrary time series indicator CSVs can be uploaded to UrbanCanvas and can be stored in your database. These files can be associated with any uploaded shapefile geometries and visualized and queried as a map layer just like the autogenerated simulation exported indicator layers. If you are uploading indicators that use geometries not provided by UrbanSim, it is suggested to upload the corresponding geometries as a general shapefile however any uploaded polygon shapefile can be used. Currently only polygon shapefiles are supported to join with indicators. To join the indicator CSV to an uploaded shapefile, you must provide the name of the column in the CSV (CSV key column) that has ID values that match ID values in a column in an uploaded shapefile (Uploaded shapefile key column). The shapefile to join the table to must be specified using the uploaded file ID (Uploaded shapefile ID). See the indicator data schema table and an example of a time series indicator table below.
This uploader uses the same method used to automatically upload indicators from simulation runs and is provided as a convenience to upload ad-hoc indicator layers. All indicators exported by simulation runs will be saved as a record in the indicator upload table and can be deleted or renamed. Deleting a record here will remove the layer from the layers panel and renaming a record here will rename the layer in the layers panel.
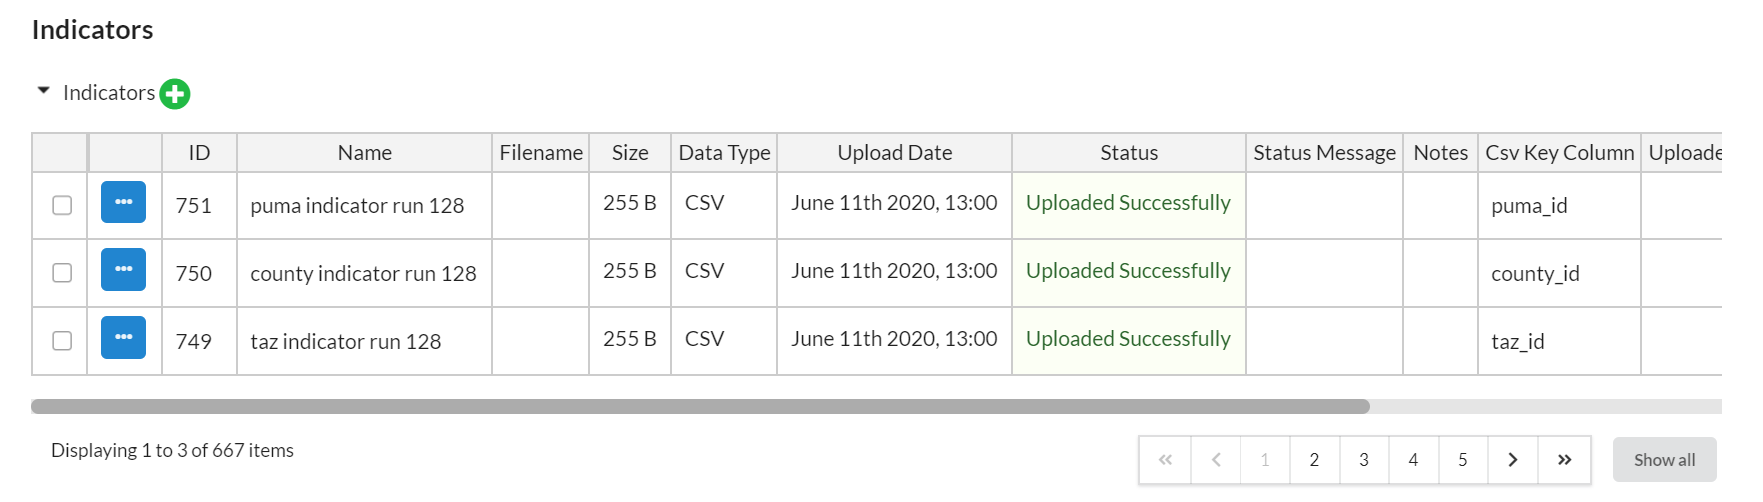
Note
At this time you are unable to undo a deletion.
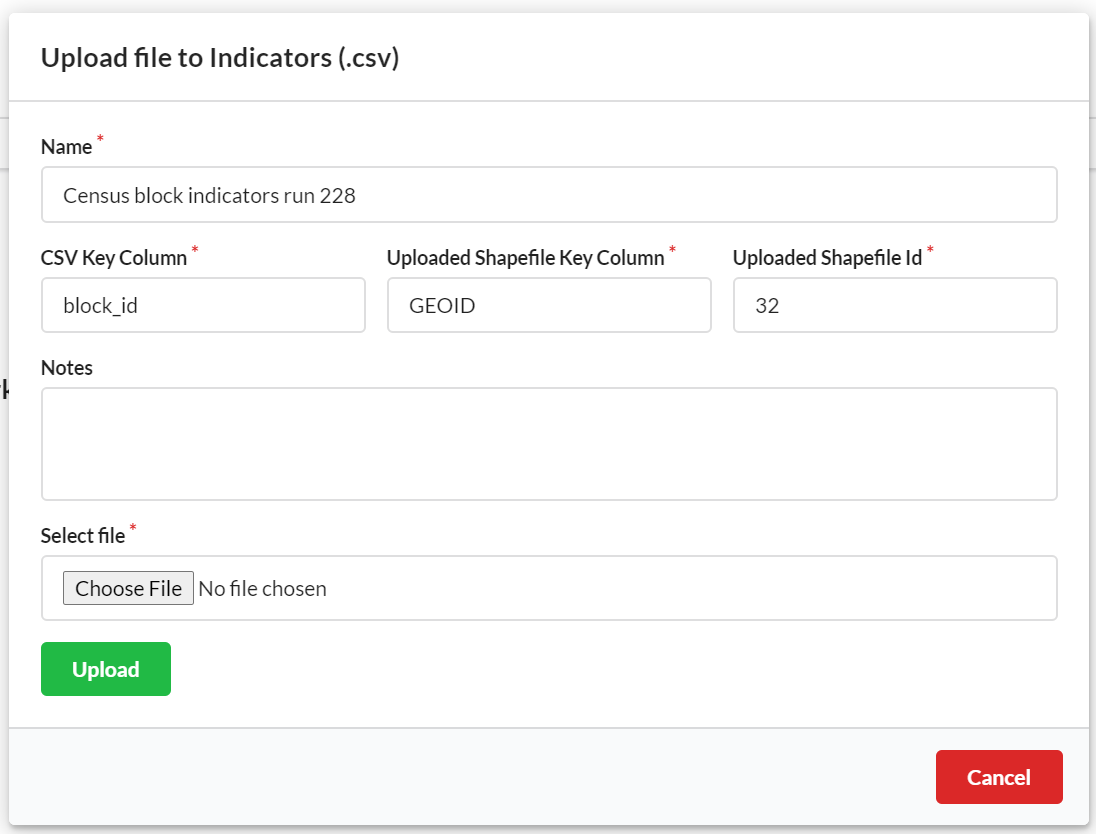
The upload form accepts the following inputs:
Name file (Required)
The name of the indicator should be distinct. This name will be used as the map layer name in the layers panel.
CSV key column (Required)
The name of the column in the CSV file with IDs to use to join to the corresponding uploaded shapefile key column. Data type of column must be the same data type as the Uploaded shapefile key column.
Uploaded shapefile key column (Required)
The name of the column in the uploaded shapefile with IDs to use to join to the corresponding indicator CSV key column. Data type of column must be the same data type as the CSV key column.
Uploaded shapefile ID (Required)
The UrbanCanvas file ID of the uploaded shapefile to use to join the indicator CSV table to. This file should contain the polygon geometries needed to generate the map layer. ID must be an integer.
Notes (Optional)
Notes can be added to include any other pertinent information.
Column Name |
Data Type |
Required |
Description |
|---|---|---|---|
[ARBITRARY_COLUMN_NAME] |
Integer or string |
Yes |
CSV key column: Column with any name that contains ID values |
year |
Integer |
Yes |
Column with years as 4-digit integers. No null values. |
[ARBITRARY_COLUMN_NAMES] |
Integer or float |
Yes |
One or more number of columns with unique |
Time series indicator CSVs should be in a long format where there are unique CSV key values for each year. The columns used to link indicator records in the CSV (CSV key column) to an uploaded shapefile geometries (Uploaded shapefile key column) must both have the same column data types but do not need to have the same column name. IDs that do not match between the two files will be flagged if found during validation. Years in the year column cannot have nulls and do not need to be continuous. CSV key column values should be unique for each unique year in the year column. Table should contain one or more indicator variable columns. Columns containing indicator variables can have any arbitrary name but must be unique column names and data types must be either float or integer. It is suggested to make variable column names as descriptive as possible for reference to users viewing the data as column names will be populated for the layer in the map and in the layer field list. See an example of a time series indicator table below.
block_id |
year |
total_population |
total_jobs |
jobs_sector_51 |
|---|---|---|---|---|
270530272022002 |
2010 |
100 |
0 |
0 |
270530272022008 |
2010 |
50 |
10 |
5 |
270530272022001 |
2010 |
200 |
50 |
10 |
270530272022002 |
2015 |
150 |
0 |
5 |
270530272022008 |
2015 |
55 |
50 |
20 |
270530272022001 |
2015 |
300 |
100 |
20 |
270530272022002 |
2020 |
300 |
0 |
0 |
270530272022008 |
2020 |
80 |
100 |
80 |
270530272022001 |
2020 |
1000 |
500 |
60 |
General Upload Limitations
UrbanCanvas does not support the upload of polygon shapefiles with more than 1 million vertices for a single polygon. If you encounter this issue, depending on the data, it is suggested you simplify the geometries in the shapefile or split multipart polygons into single part polygons.
UrbanCanvas does not currently support the upload of CSVs with column names that have more than 31 characters.