Chart Dashboard
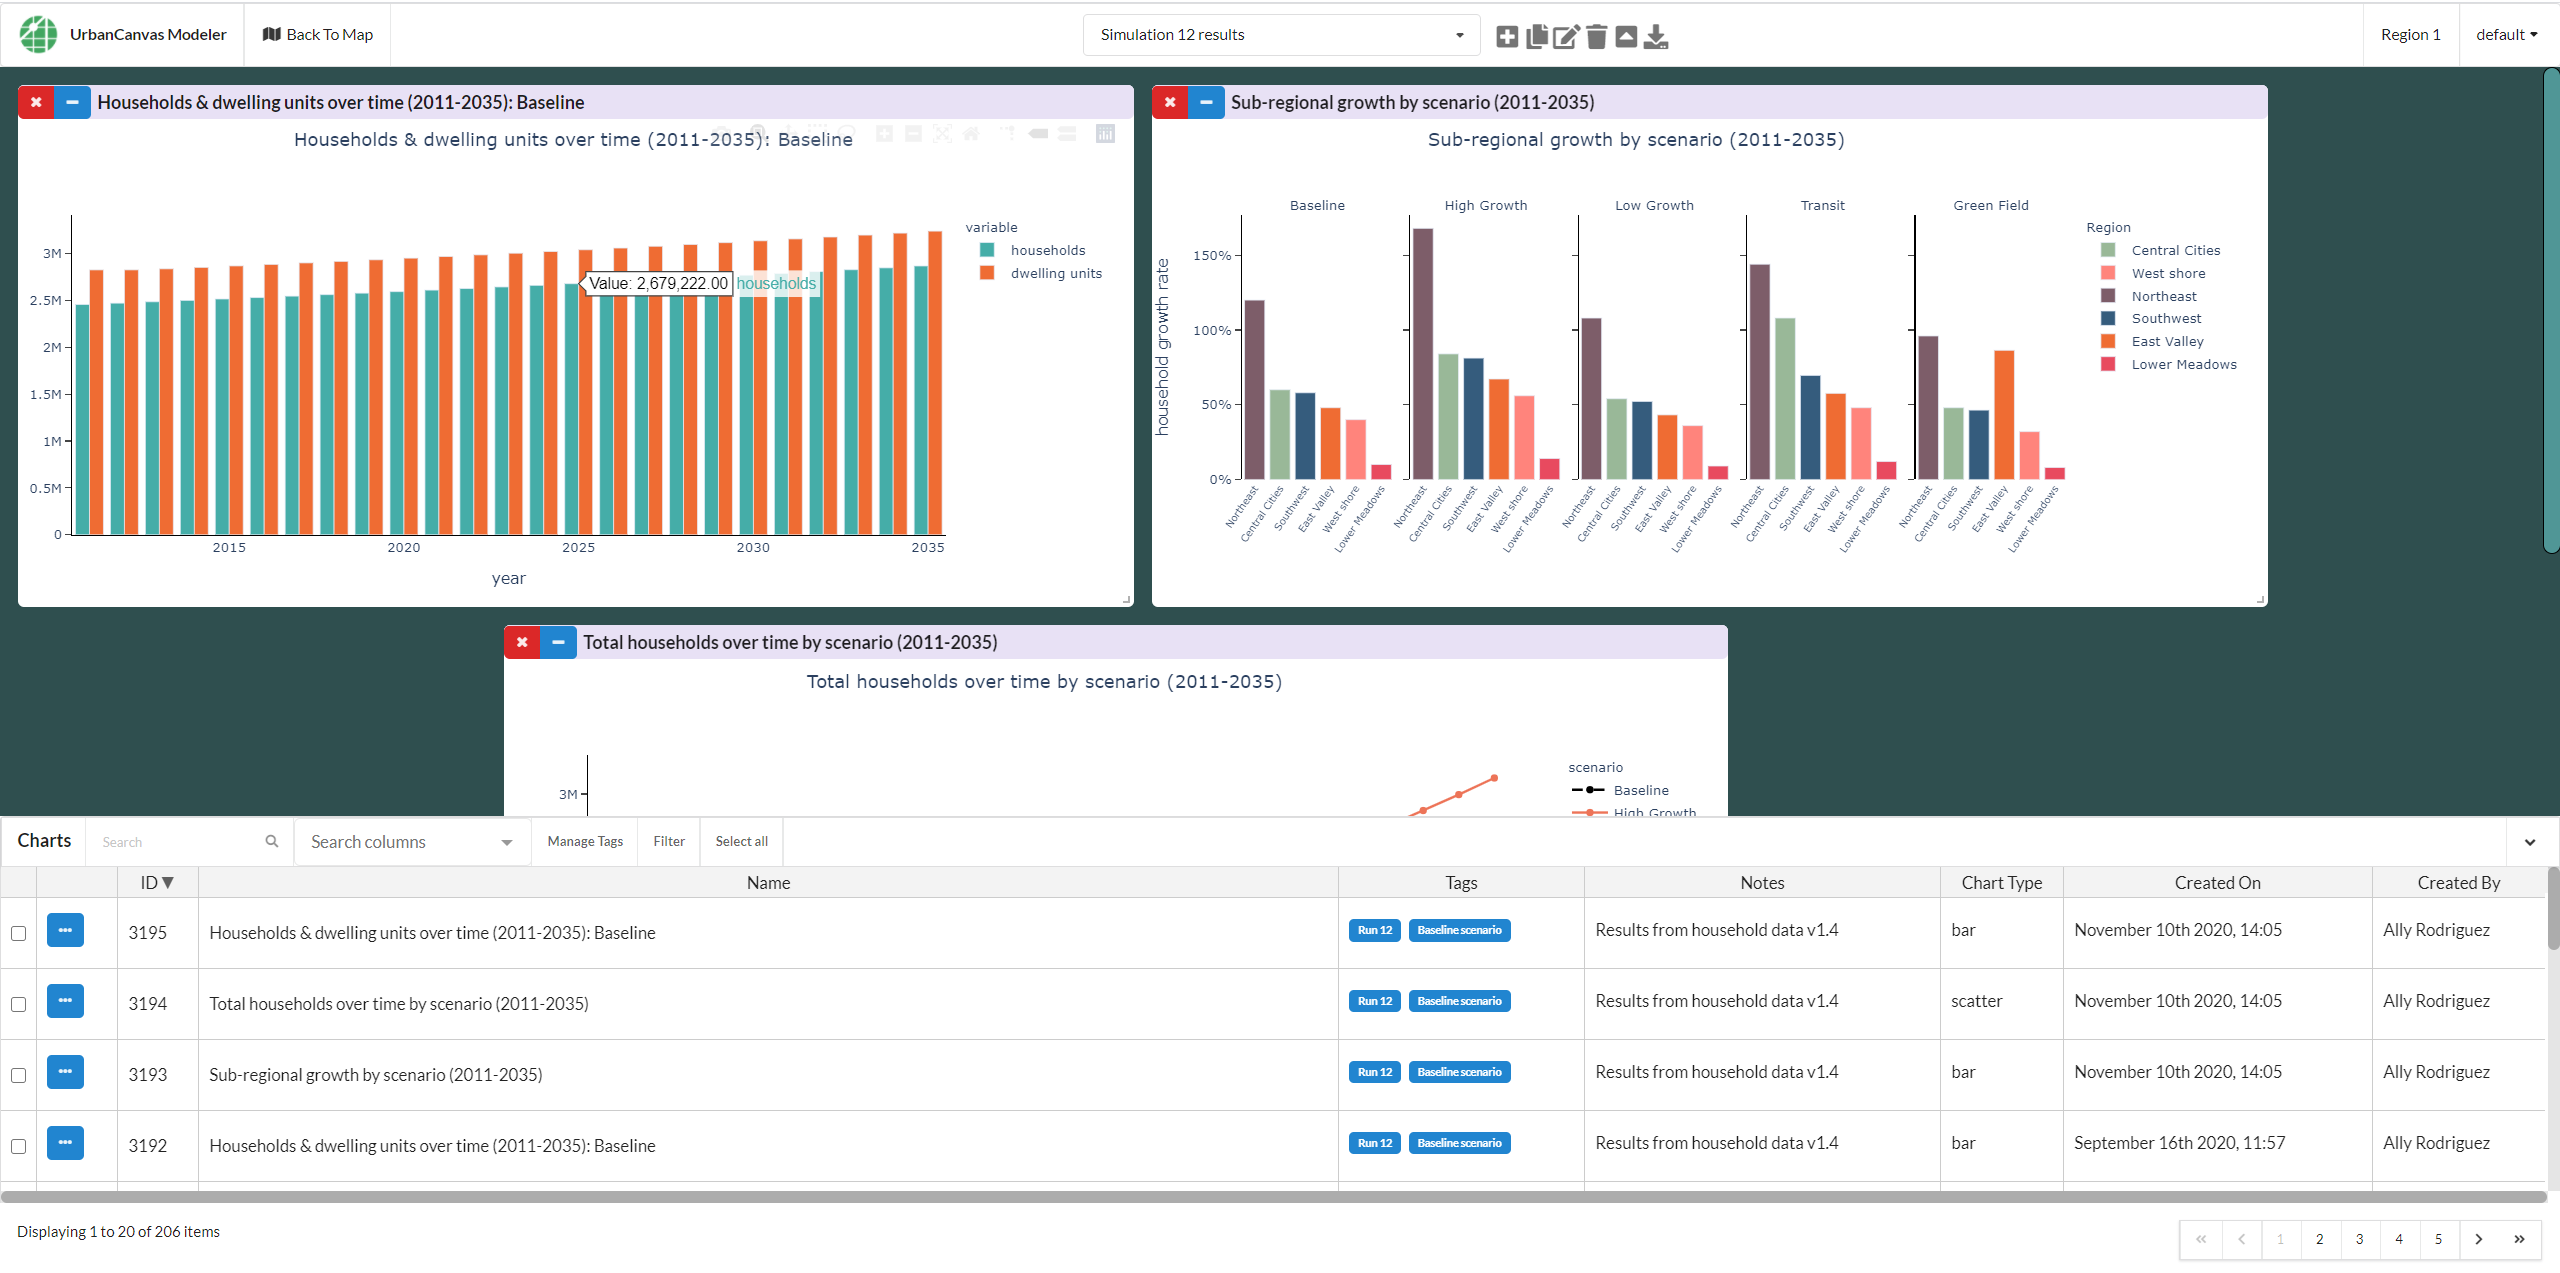
Charts exported to UrbanCanvas can be viewed and managed from within the chart dashboard interface. To open the chart dashboard click on the chart icon ![]() at the top right hand side of UrbanCanvas. Typically, charts are automatically configured to be generated and exported from successful simulation runs. See the chart indicator section for more information on pre-defined charts. The content and layout of charts created from simulation runs is controlled by your specific model implementation and configuration. Chart data and basic layout cannot be modified from within UrbanCanvas.
at the top right hand side of UrbanCanvas. Typically, charts are automatically configured to be generated and exported from successful simulation runs. See the chart indicator section for more information on pre-defined charts. The content and layout of charts created from simulation runs is controlled by your specific model implementation and configuration. Chart data and basic layout cannot be modified from within UrbanCanvas.
The chart dashboard interface can be used to view charts by adding a chart or multiple charts to a dashboard. Charts can then be resized, rearranged, and interacted with inside the dashboard. Charts can be downloaded as PNG files and you can manage your charts by editing chart metadata such as chart title, chart tags, and notes, and you can delete charts that are no longer needed.
Multiple chart dashboards can be created and saved. Metadata associated with saved dashboards can be modified, dashboards can be copied and deleted, and charts in a dashboard can be downloaded all at once.
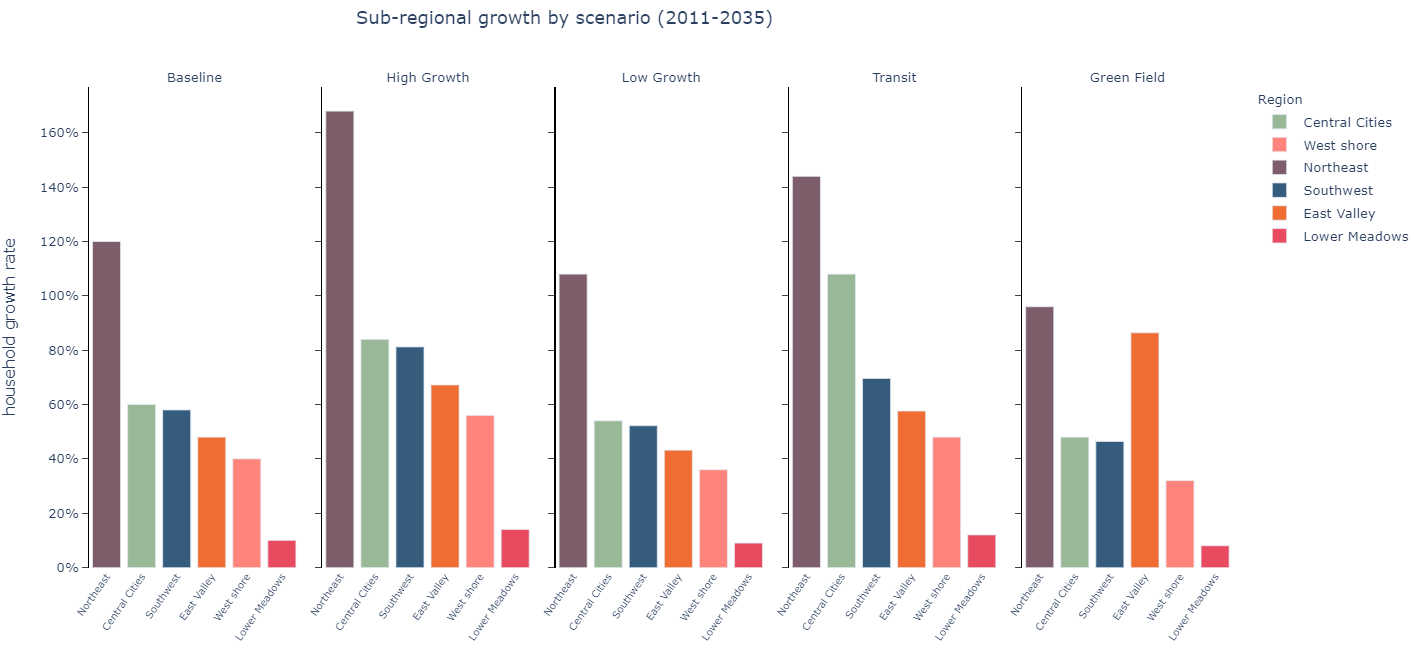
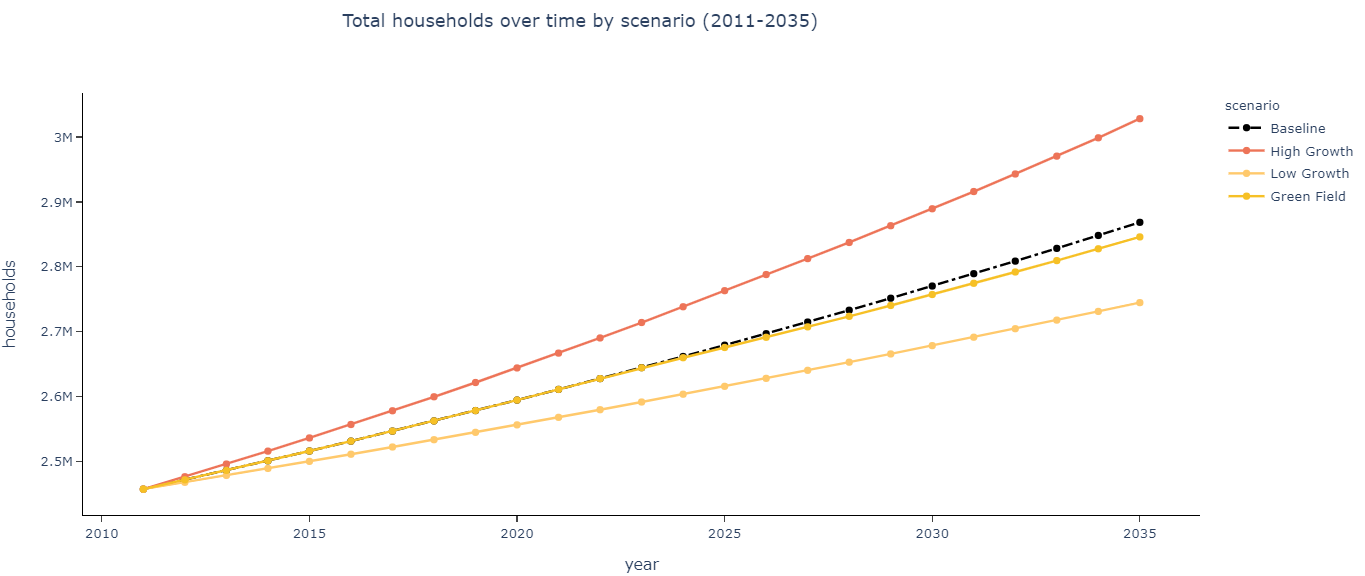
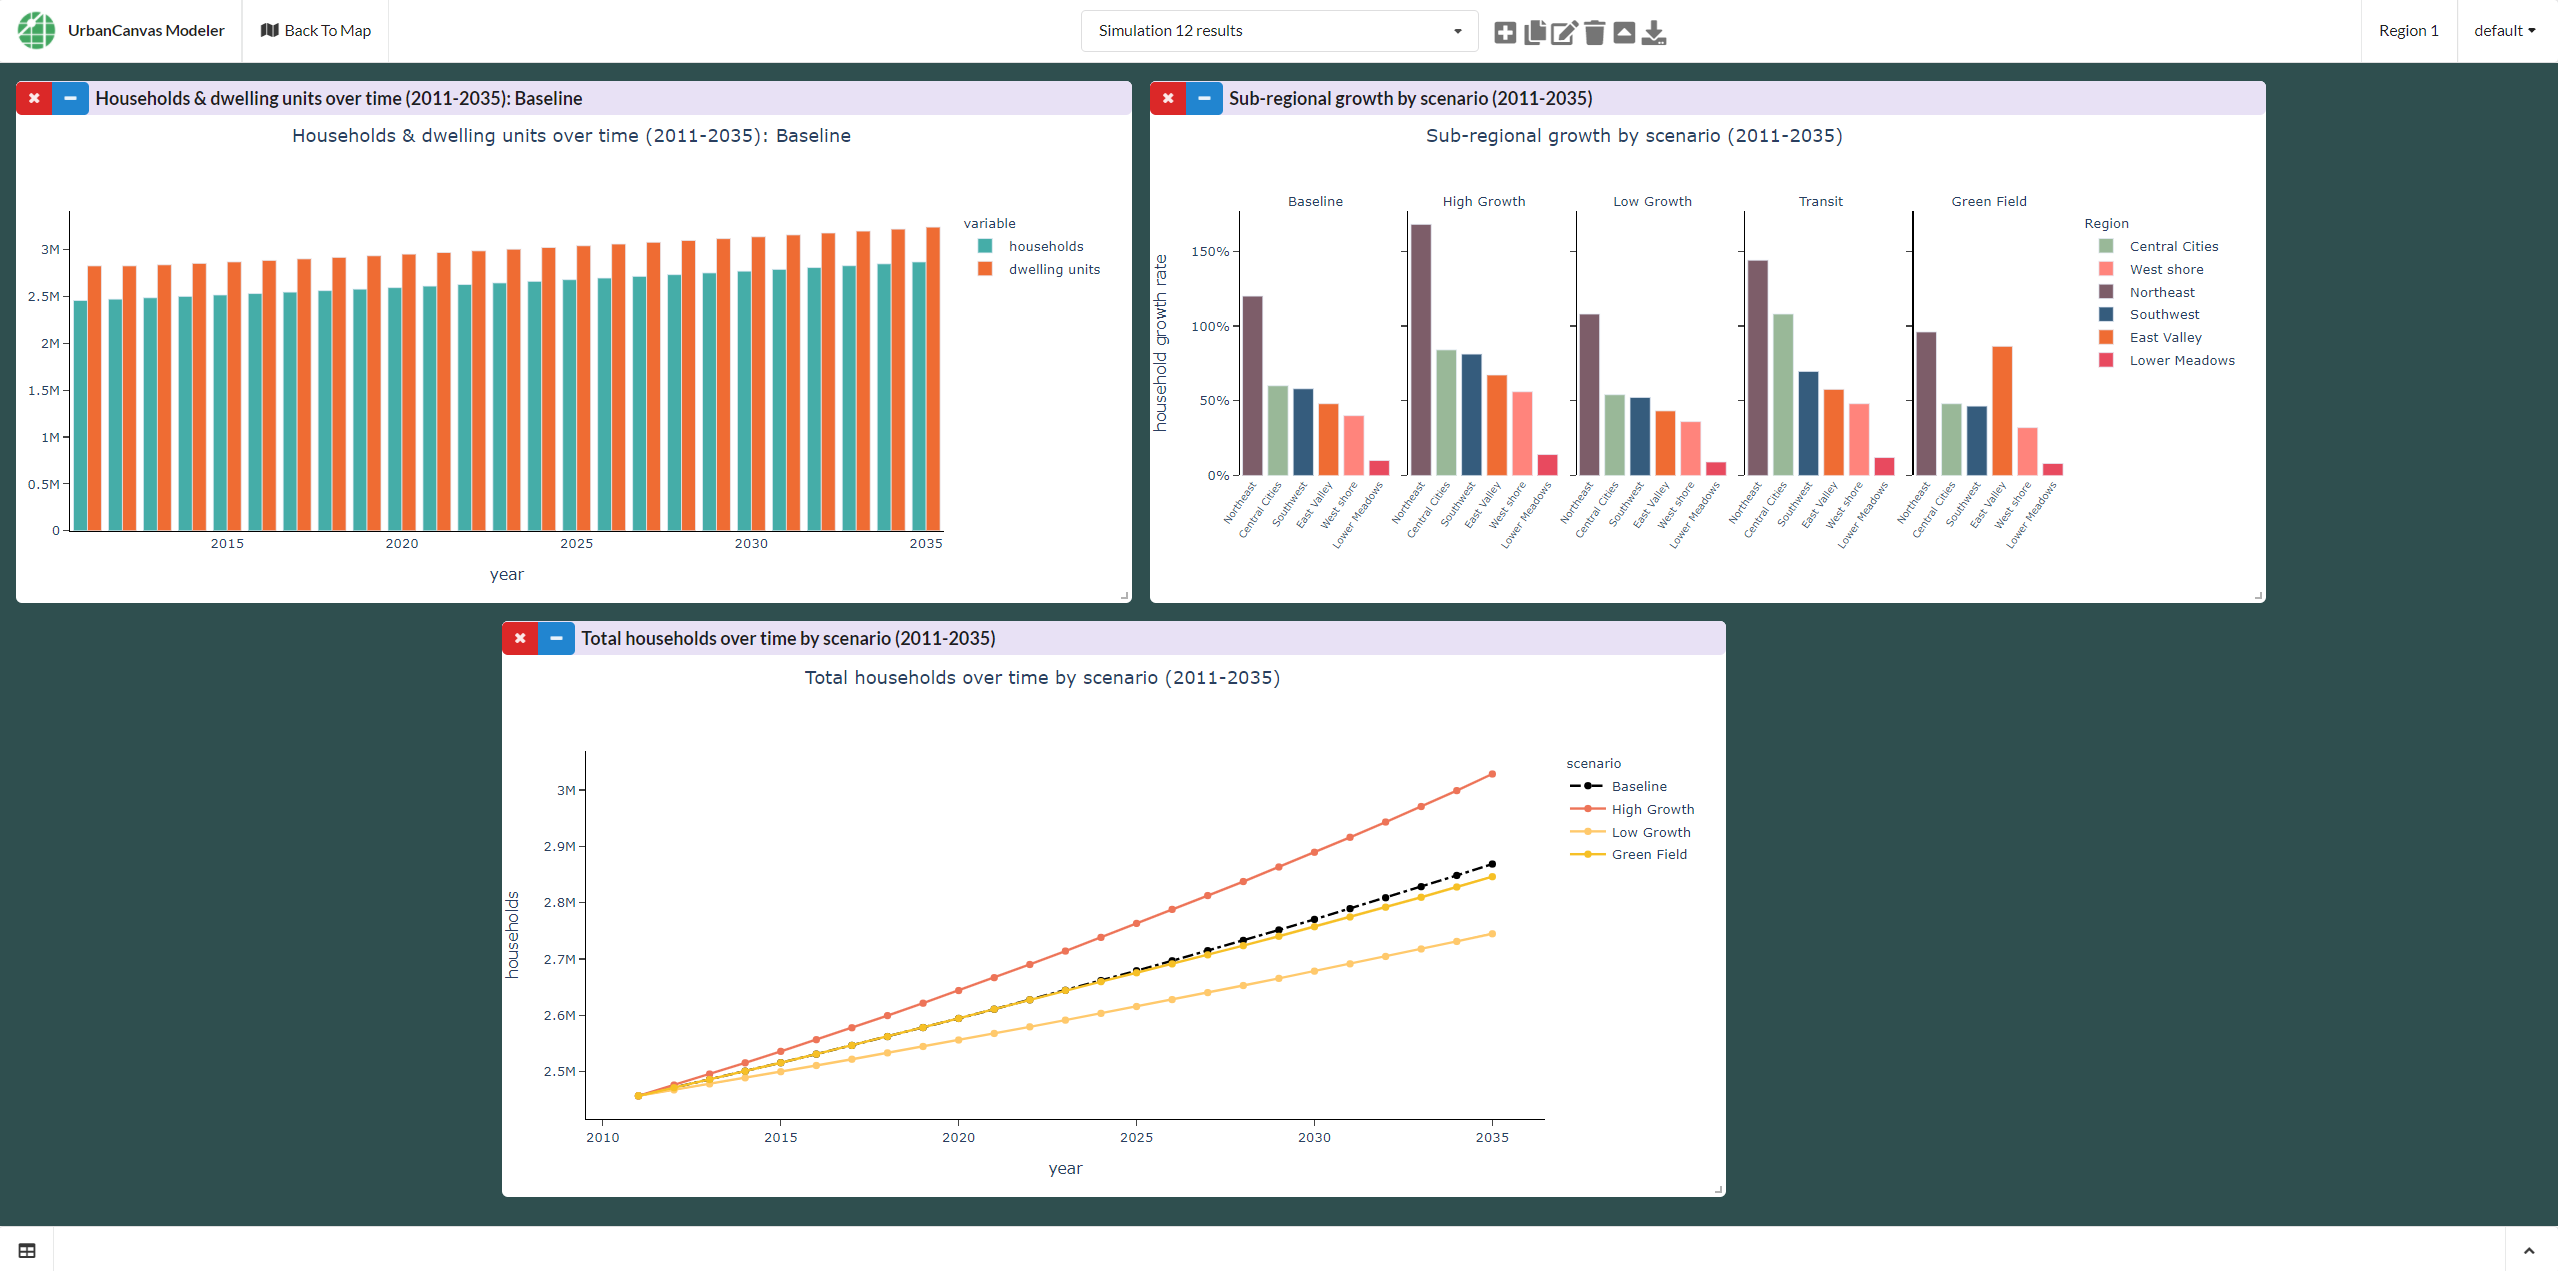
Examples of Plotly charts
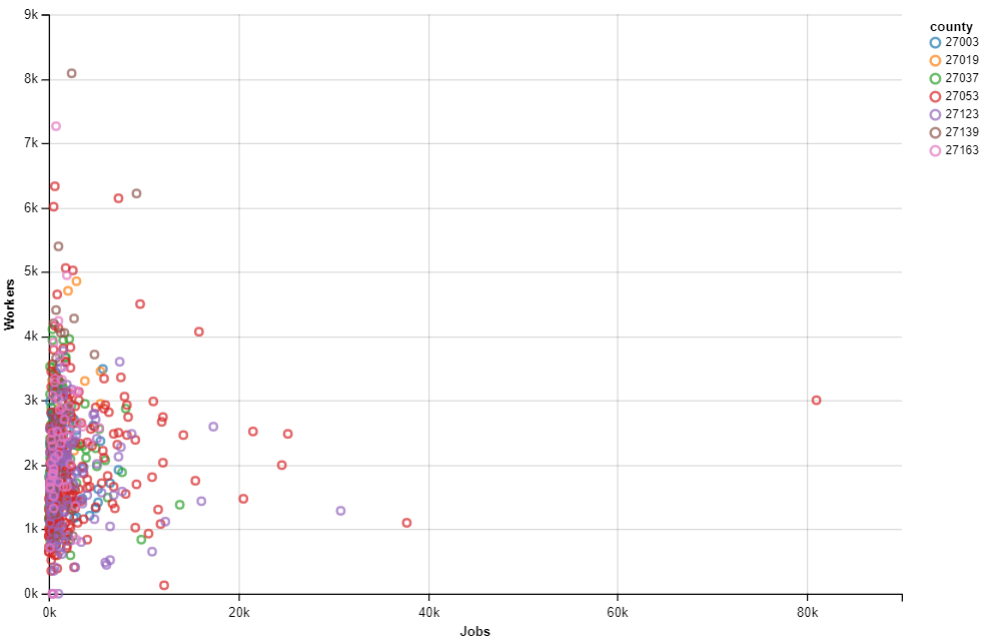
An example of an Altair chart
Note
UrbanCanvas Viewers may or may not have these features enabled. Feature permissions are determined by your account administrator.
Using the chart dashboard
Chart dashboard actions
Create a new dashboard

Using the dashboard menu, click on the Create new dashboard button. A new empty dashboard will be created with the default name New dashboard that can be changed by editing the metadata for the dashboard. Note: All changes made to a dashboard are saved in real time and cannot be undone at this time.
Edit and rename dashboard
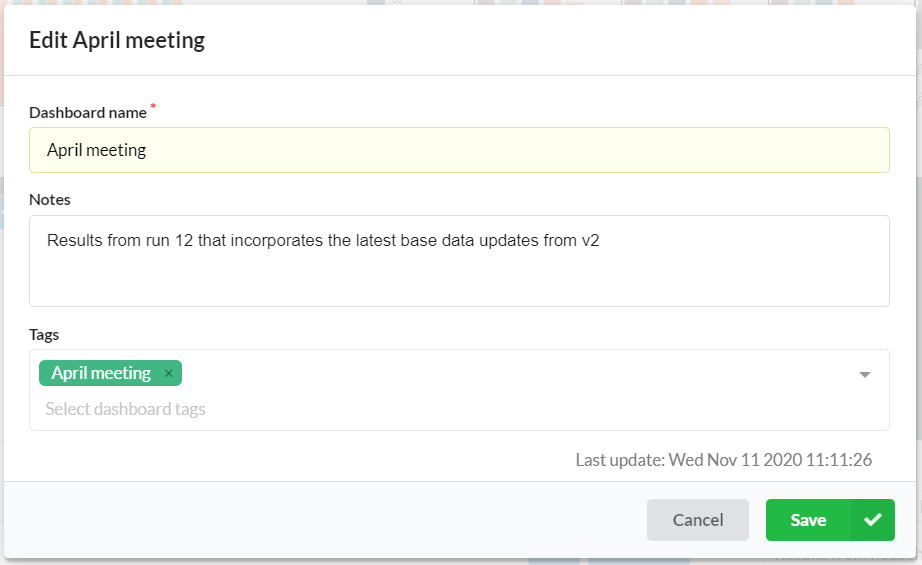
Using the dashboard menu, click on the Rename and edit dashboard metadata button. In the edit dashboard window you can rename the dashboard and add notes and tags.
Name (Required)
The chart dashboard name should be descriptive. This name is displayed on the header of the chart dashboard dropdown menu and can be changed at anytime.
Notes (Optional)
Notes can be added to include any other pertinent information for greater context.
Tags
Tags can be applied to dashboards to help organize multiple dashboards. See the tag section for more information on tags.
Copy dashboard
Using the dashboard menu, click on the Create copy of dashboard button. The dashboard you are currently viewing will be copied to a new dashboard.
Load a saved dashboard
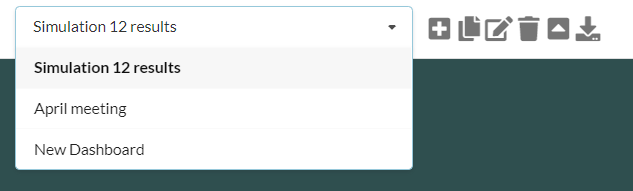
Using the dashboard menu, click on the dashboard dropdown menu that displays the name of the currently loaded dashboard and select from the list a dashboard to load.
Saving dashboards
Dashboards are saved in real time after each change.
Note
All changes made to a dashboard are saved in real time and cannot be undone at this time.
Download dashboard charts
Using the dashboard menu, click on the Download dashboard charts button. All charts on the dashboard you are currently viewing will be downloaded. Charts will be downloading using the current chart dimensions for each chart in the dashboard.
Deleting a dashboard
Using the dashboard menu, click on the Delete dashboard button and confirm the action.
Note
At this time you are unable to undo a deletion.
Adding charts to the dashboard
Charts can be added to the dashboard individually by using the blue action button on a chart record and selecting the Add to dashboard button. Alternatively you can select multiple chart records at once to add to the dashboard. Once your selection has been made using the check boxes on the desired chart records, click on the Add to dashboard button in the header of the table. Note that a chart can only be added once to a dashboard. When there are charts already on the dashboard, new charts will be added to the top of the dashboard.
Arranging charts on the dashboard
Charts can be resized by clicking and dragging the edge or corner of a chart in the dashboard to the desired size. Charts can be moved and rearranged inside the dashboard by clicking and holding the top bar of the chart and dragging the chart to a new position. When dragging a chart, the red box indicator that appears around the chart can be used to guide your placement of the chart in the dashboard.
Charts can be minimized or expanded by clicking on the blue + or - icon on the top bar of the chart.
To remove a chart from the dashboard, click on the red x in the top bar of the chart. The chart will be removed from the dashboard and can be added again at anytime.
Compress charts on the dashboard
Charts in the dashboard can be vertically compressed by clicking on the vertically compress dashboard charts button in the dashboard header menu. This will remove all extraneous vertical space between charts in the dashboard and bring charts into a tight vertical alignment.
Interacting with charts
The chart dashboard currently supports rendering of charts directly exported from Python using either the declarative statistical visualization libraries: 1) Altair or 2) Plotly. Plotly charts are fully interactive in the dashboard, however Altair charts are not interactive and are static. The type of chart automatically exported from the simulation will depend on your specific model configuration.
Data in a Plotly chart can be queried using your mouse. Each data point value will be displayed in a hover tooltip. In addition, if a Plotly chart has a legend you can hide and reveal specific categories of data by clicking on the legend category name.
Plotly charts in the dashboard also have an interactive toolbar that offers the following functionality:
Download chart as a PNG (will download the chart as displayed in the dashboard)
Zoom in and out of chart
Pan around the chart
Select chart data (Lasso or Box)
Autoscale chart
Reset chart axis
Toggle spike lines (e.g. x and y axis leader lines at a specific data point)
Mouse tooltip behavior (show closest data point value or compare all data values)
Using the chart table
The chart table can be hidden to either show the entire chart dashboard or can be revealed by toggling the up and down arrow button on the right hand side of the table header. See below for the other functions available in the table.
Multi-select, search, and filter charts
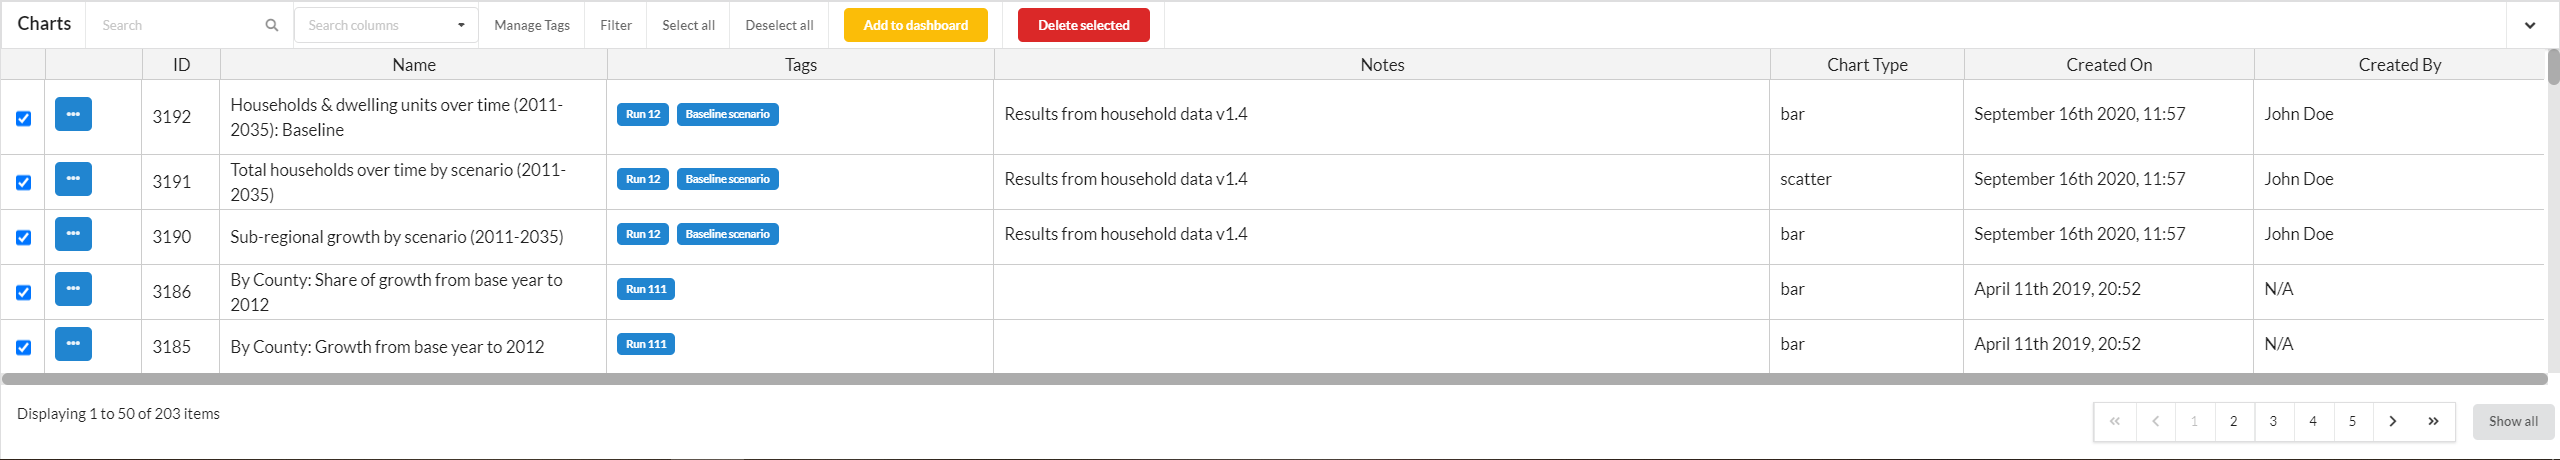
Selecting multiple charts

Filtering charts by tag
Chart records in the table can be searched, sorted, and filtered to create selection sets. The entire selection set can then be added to the dashboard or deleted if needed. You can filter chart records by tag using the filter button. See the filter section for more information. Use the check marks on the left hand side of the table or the selection buttons at the top of the same to make a selection set.
Previewing charts
Charts can be previewed prior to adding them to the dashboard by putting your cursor on the Preview button. A small popup window will appear with a simple default render of the selected chart. Note that this preview window is designed to provide a simple glimpse as to what a chart is and may not perfectly render chart layout or font as it would look if added to the dashboard.
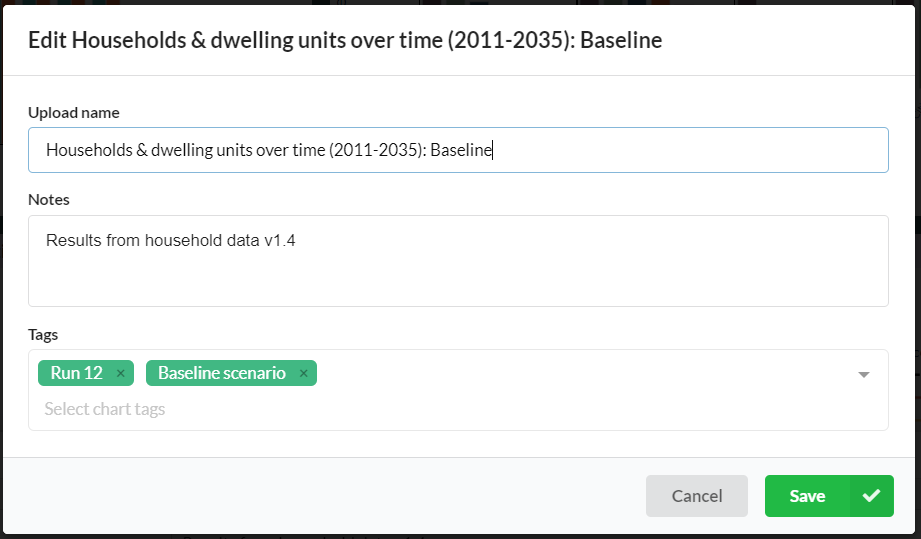
Editing chart metadata
Charts automatically exported by simulation runs will have a set of pre-defined metadata attributes assigned to each record. See the simulation chart indicator metadata section for more on what default metadata attributes are given to simulation generated charts.

To edit chart metadata:
Select a record and click on the Edit metadata icon.
Update the metadata of the record and click Save.
The following chart metadata attributes can be edited:
Upload name
The chart name should be descriptive of what the chart is displaying. This name is separate from the chart title defined when the chart was created by Altair or Plotly and can take any name. This name is displayed on the header of the chart box in the dashboard and can be changed at anytime.
Notes
Notes can be added to include any other pertinent information for context.
Tags
Tags can be applied to charts to help organize simulation results. See the tag section for more information on tags.
Downloading charts

Charts can be download by:
Selecting a chart record and clicking on the Download icon.
or
Plotly charts in your dashboard can be downloaded as a PNG by using the Plotly toolbar Download chart as a PNG button inside the specific chart.
or
Altair charts in your dashboard can be downloaded as a PNG by right clicking on the specific chart and selecting Save image as.
Deleting charts
Note
At this time you are unable to undo a deletion.
To delete a chart:
Select one or more charts by checking the boxes next to their records and click Delete selected at the top of the table.
Or
Click the Delete icon for the chart record.
Permanently deleting a chart will also remove it from the dashboard. If another user deletes a specific chart that was saved on your dashboard, that chart will be permanently removed from your dashboard. A notification will inform you what chart was deleted if this occurs upon loading or refreshing that dashboard.