Map Layers
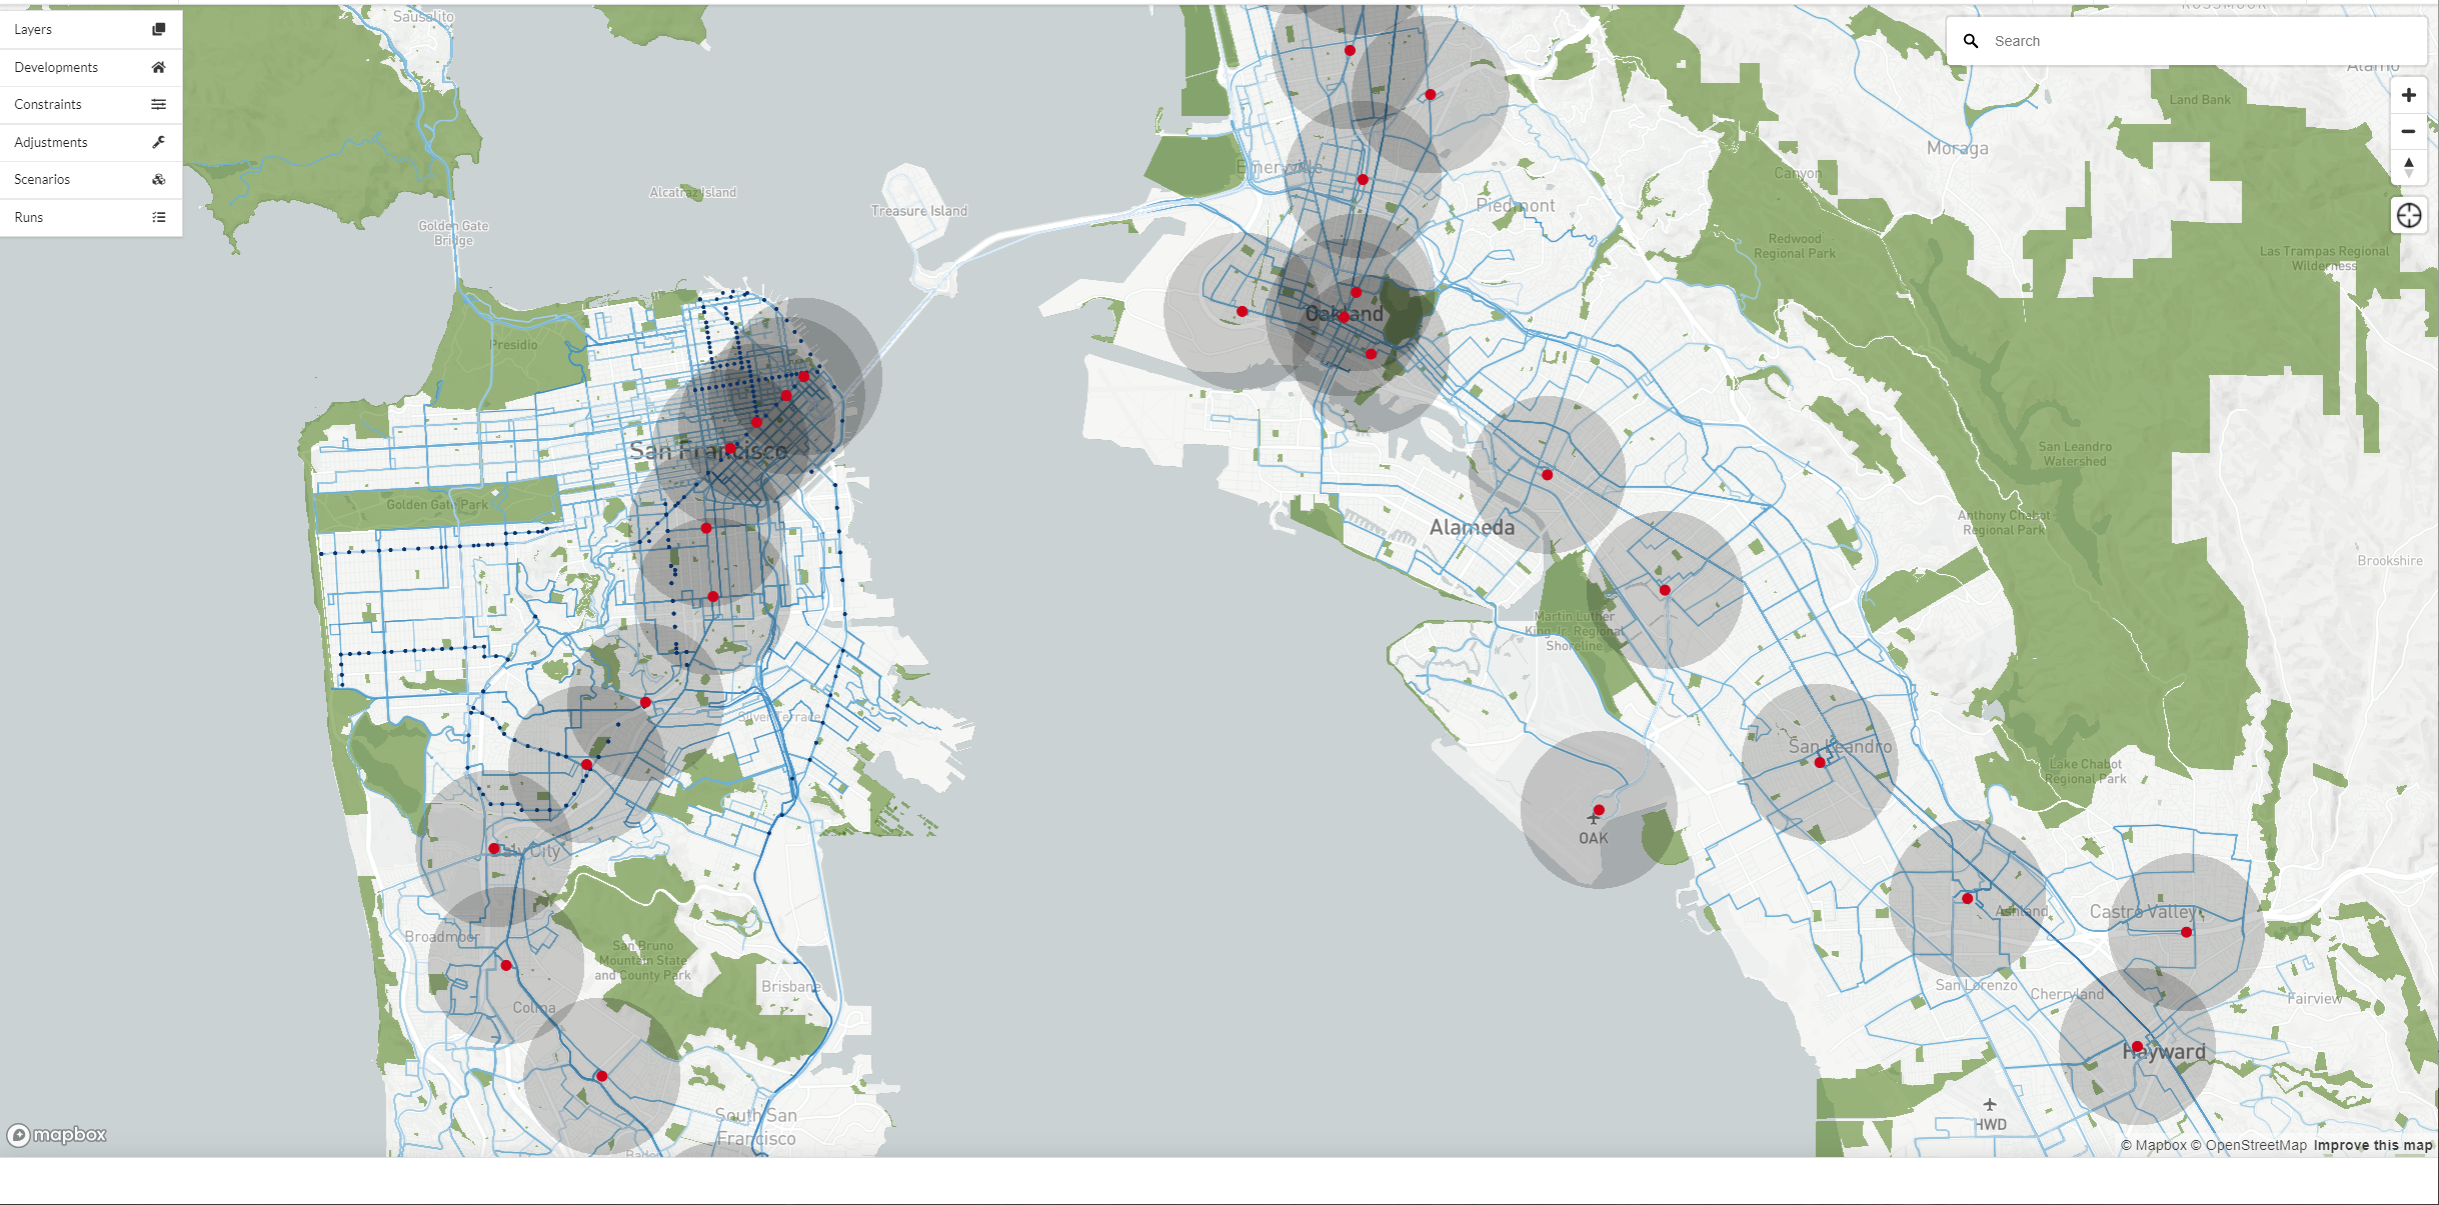
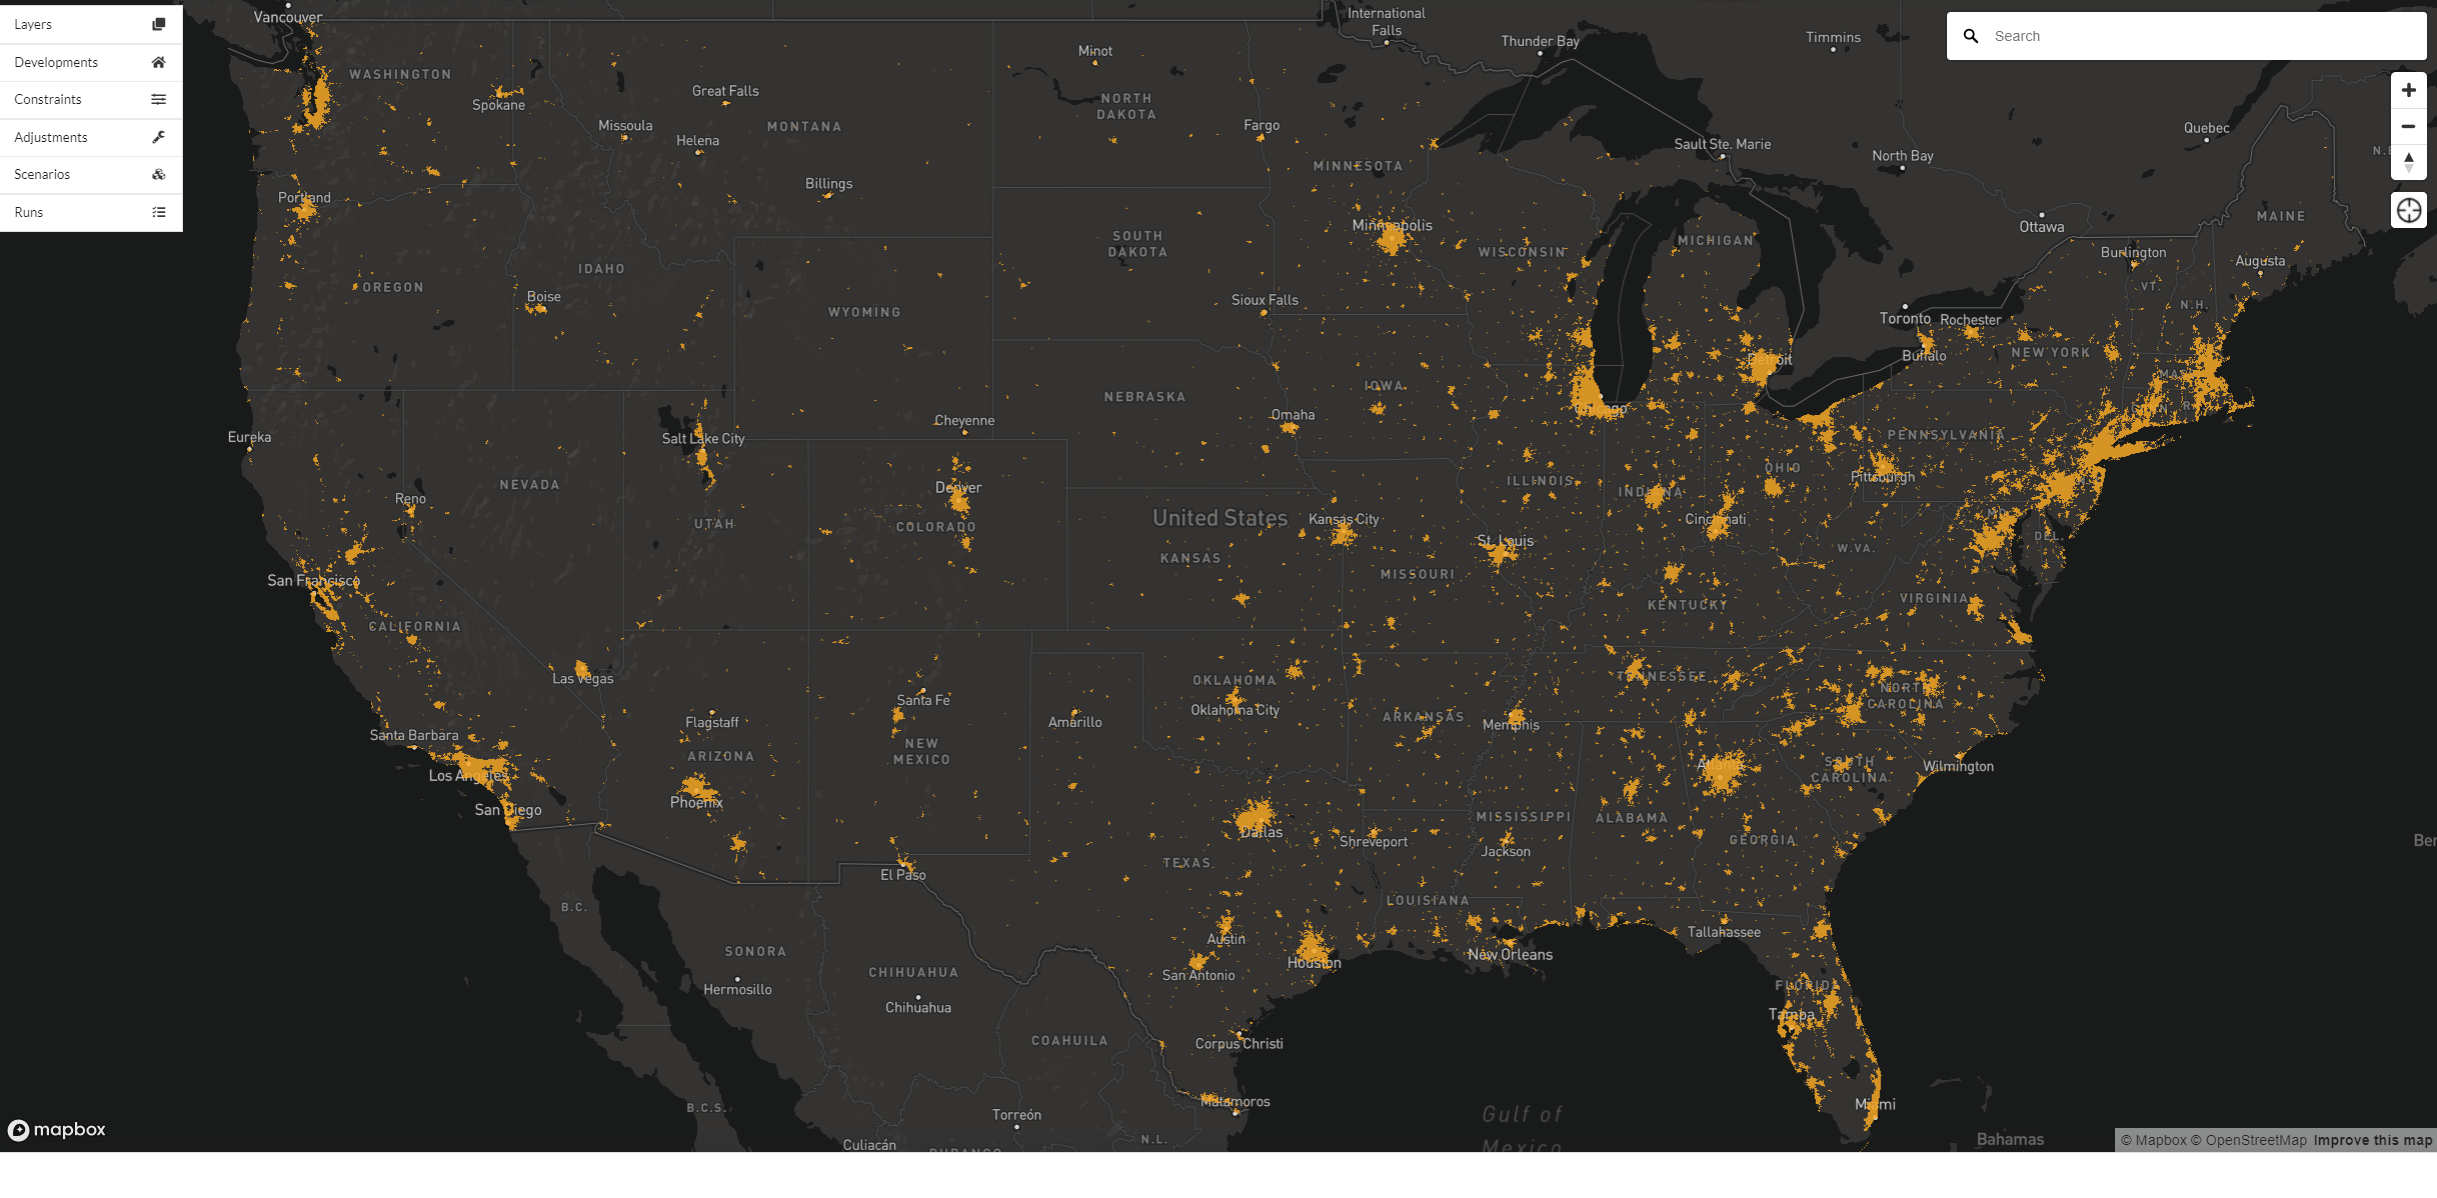
The layers menu can be used to visualize point, line, and polygon spatial information on the 3D map interface. You can view map layers derived from the following:
Any uploaded shapefile. See here on how to upload shapefiles for each model type: block model, parcel model and zone model. This includes the open ended general shapefile upload option that can be any type of shapefile.
Any spatial data related to scenarios such as development projects, constraints, and adjustments.
Simulation results exported as spatial indicators or manually uploaded time series indicators.
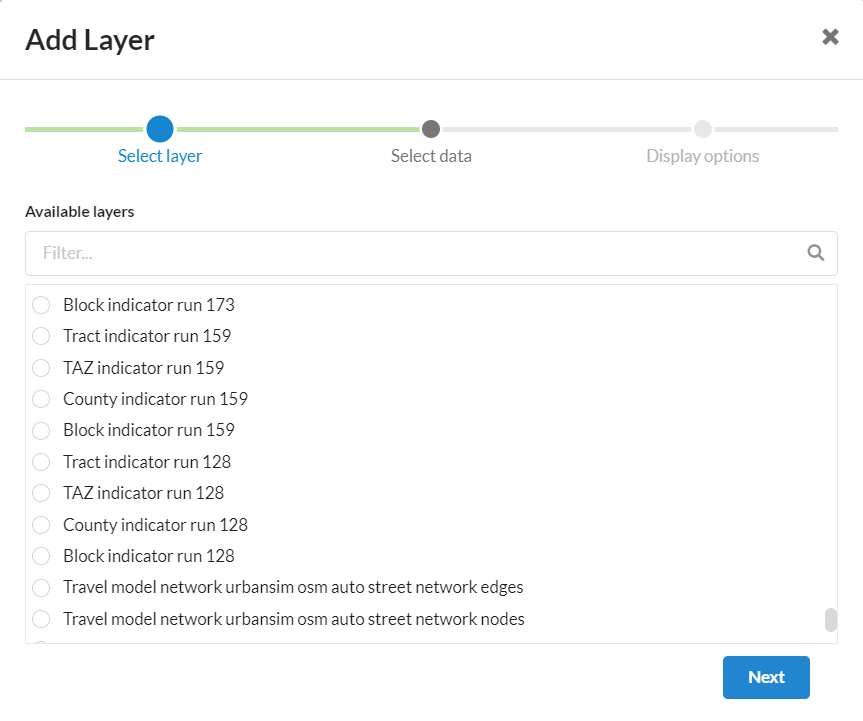
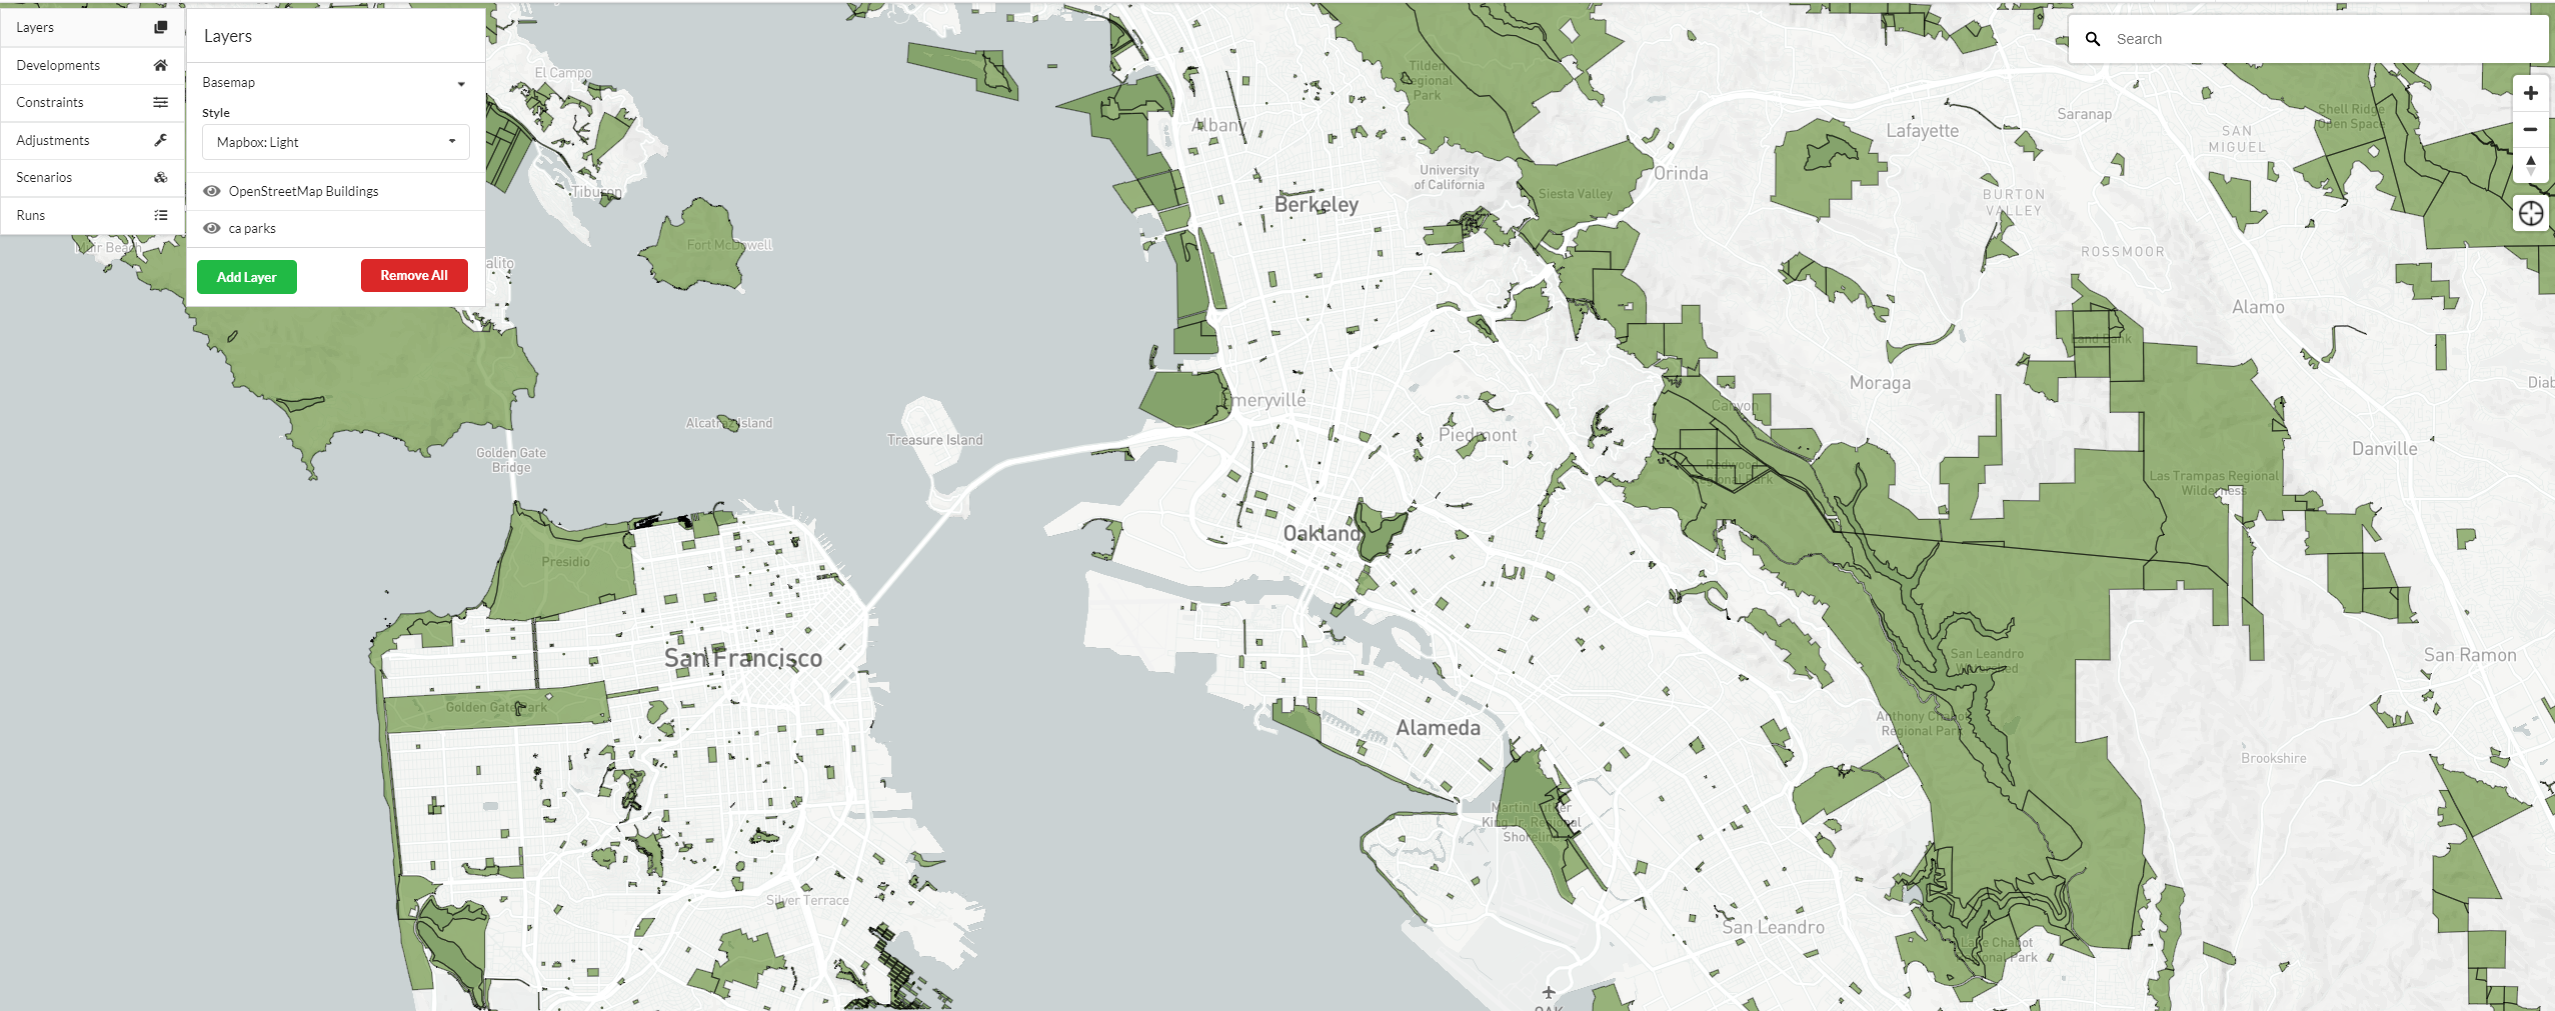
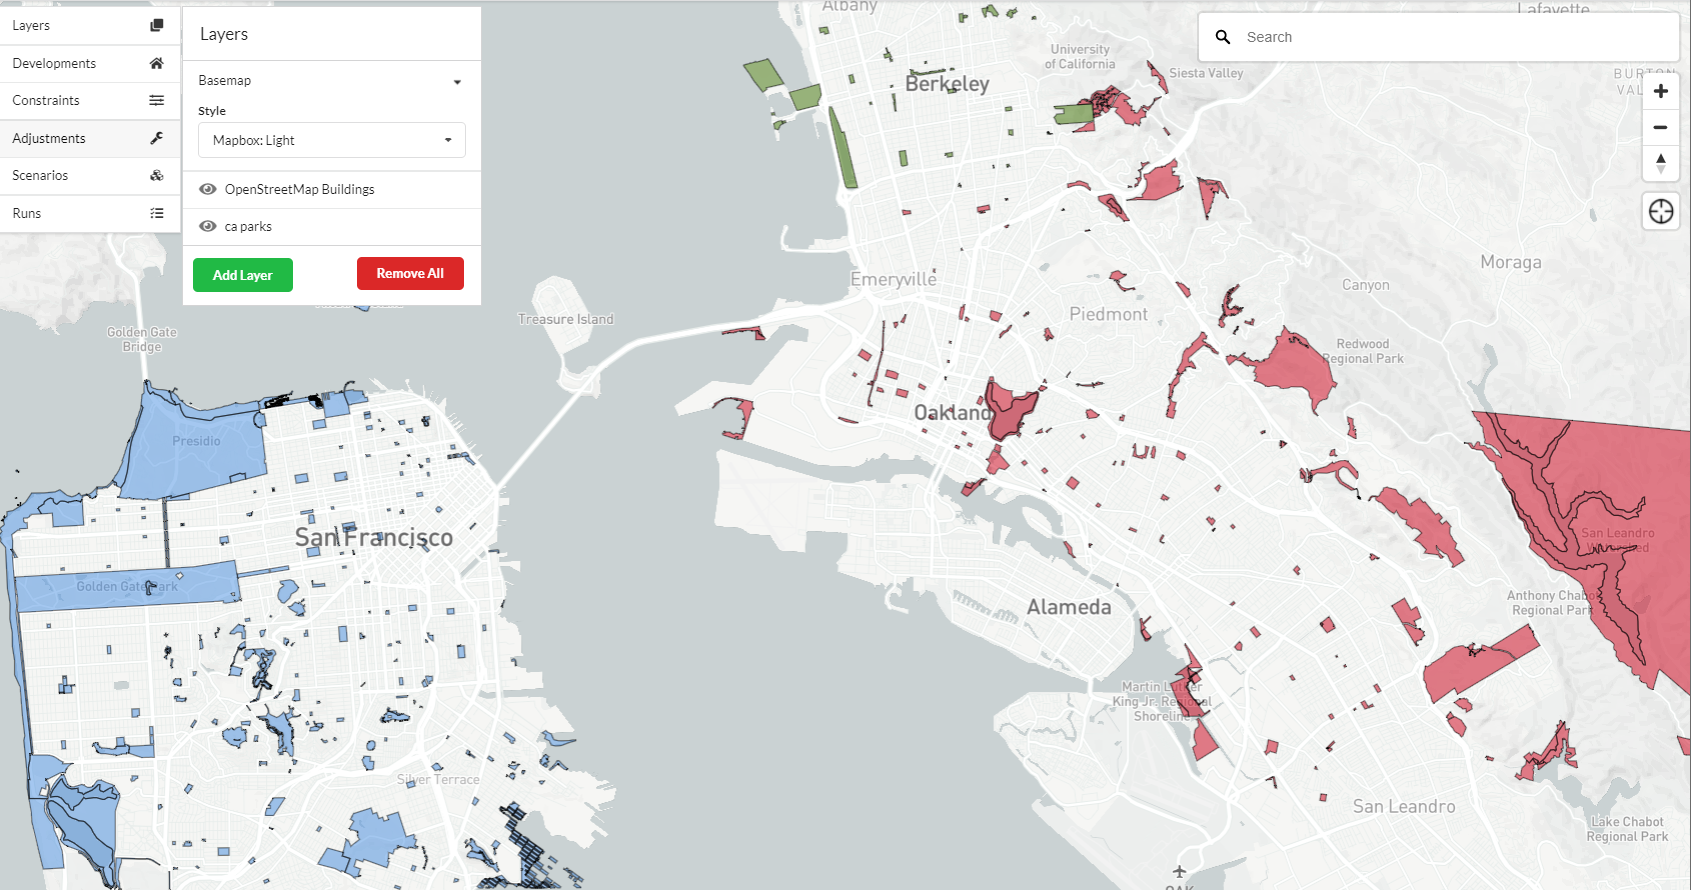
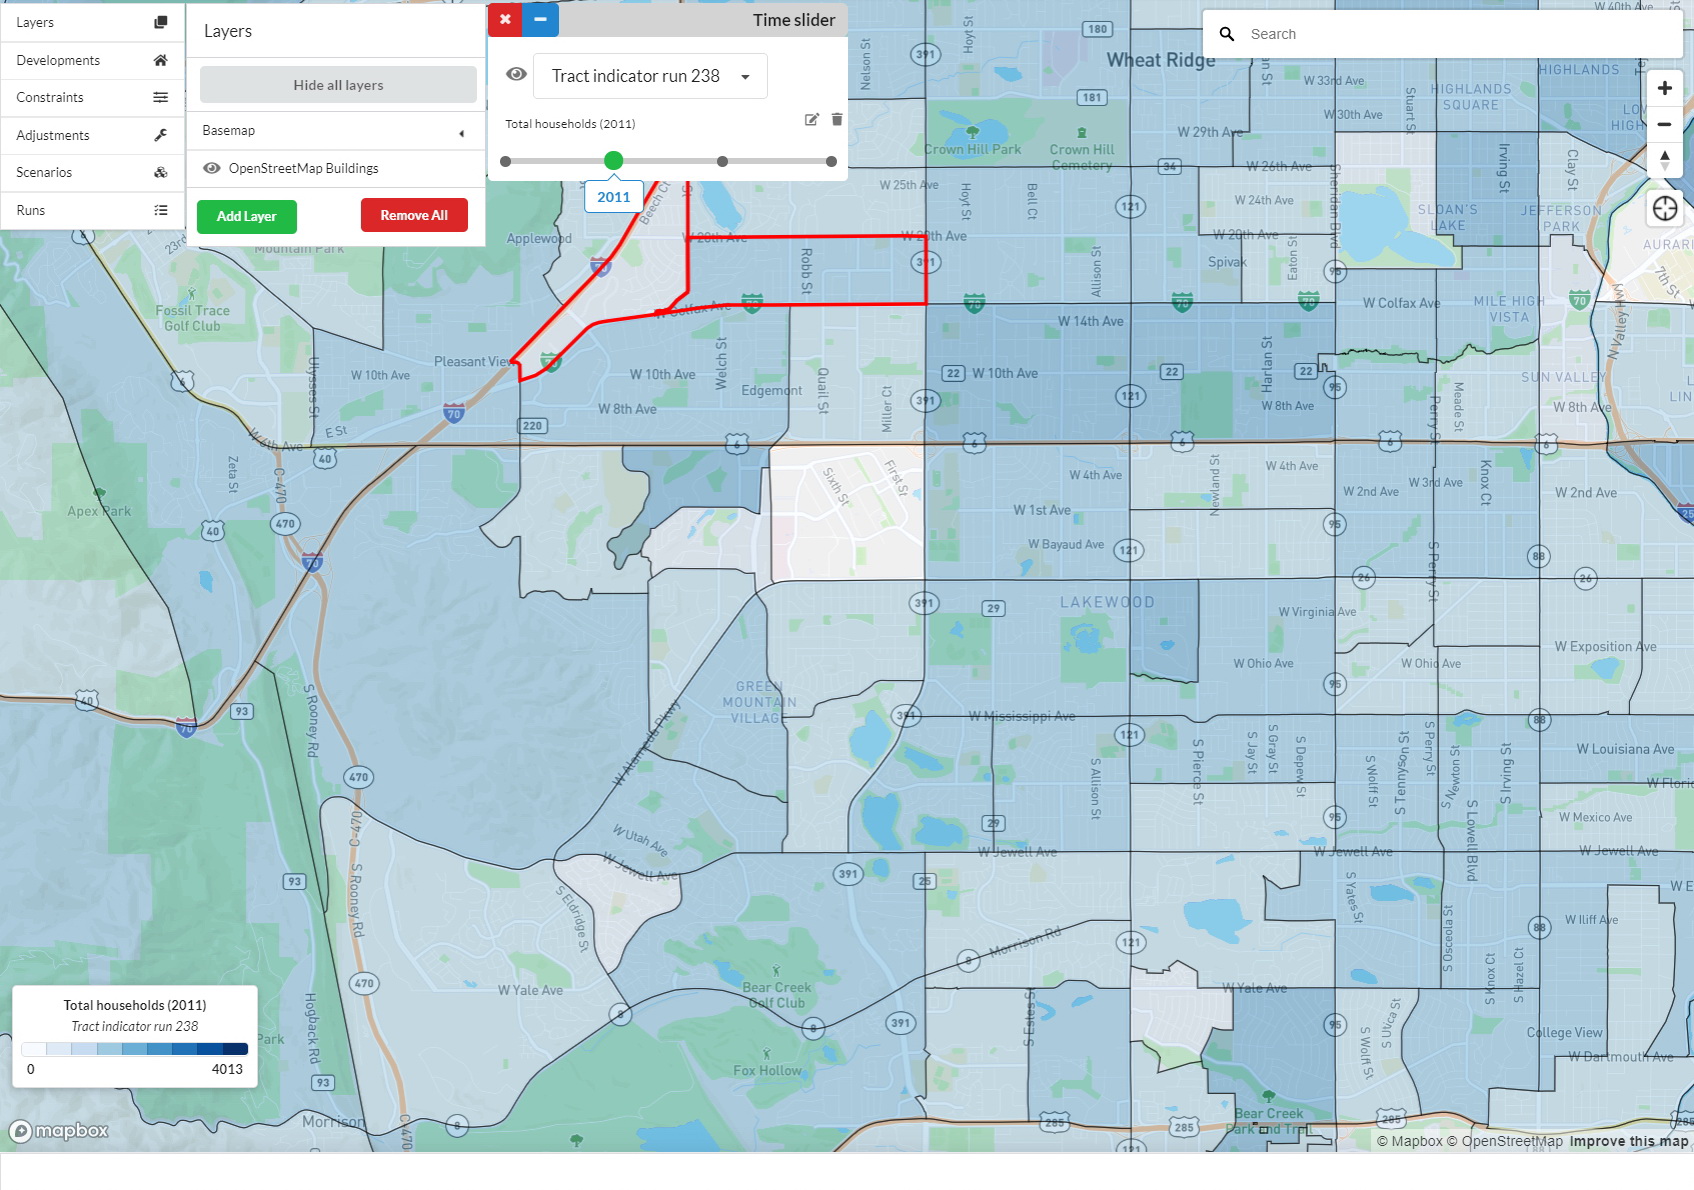
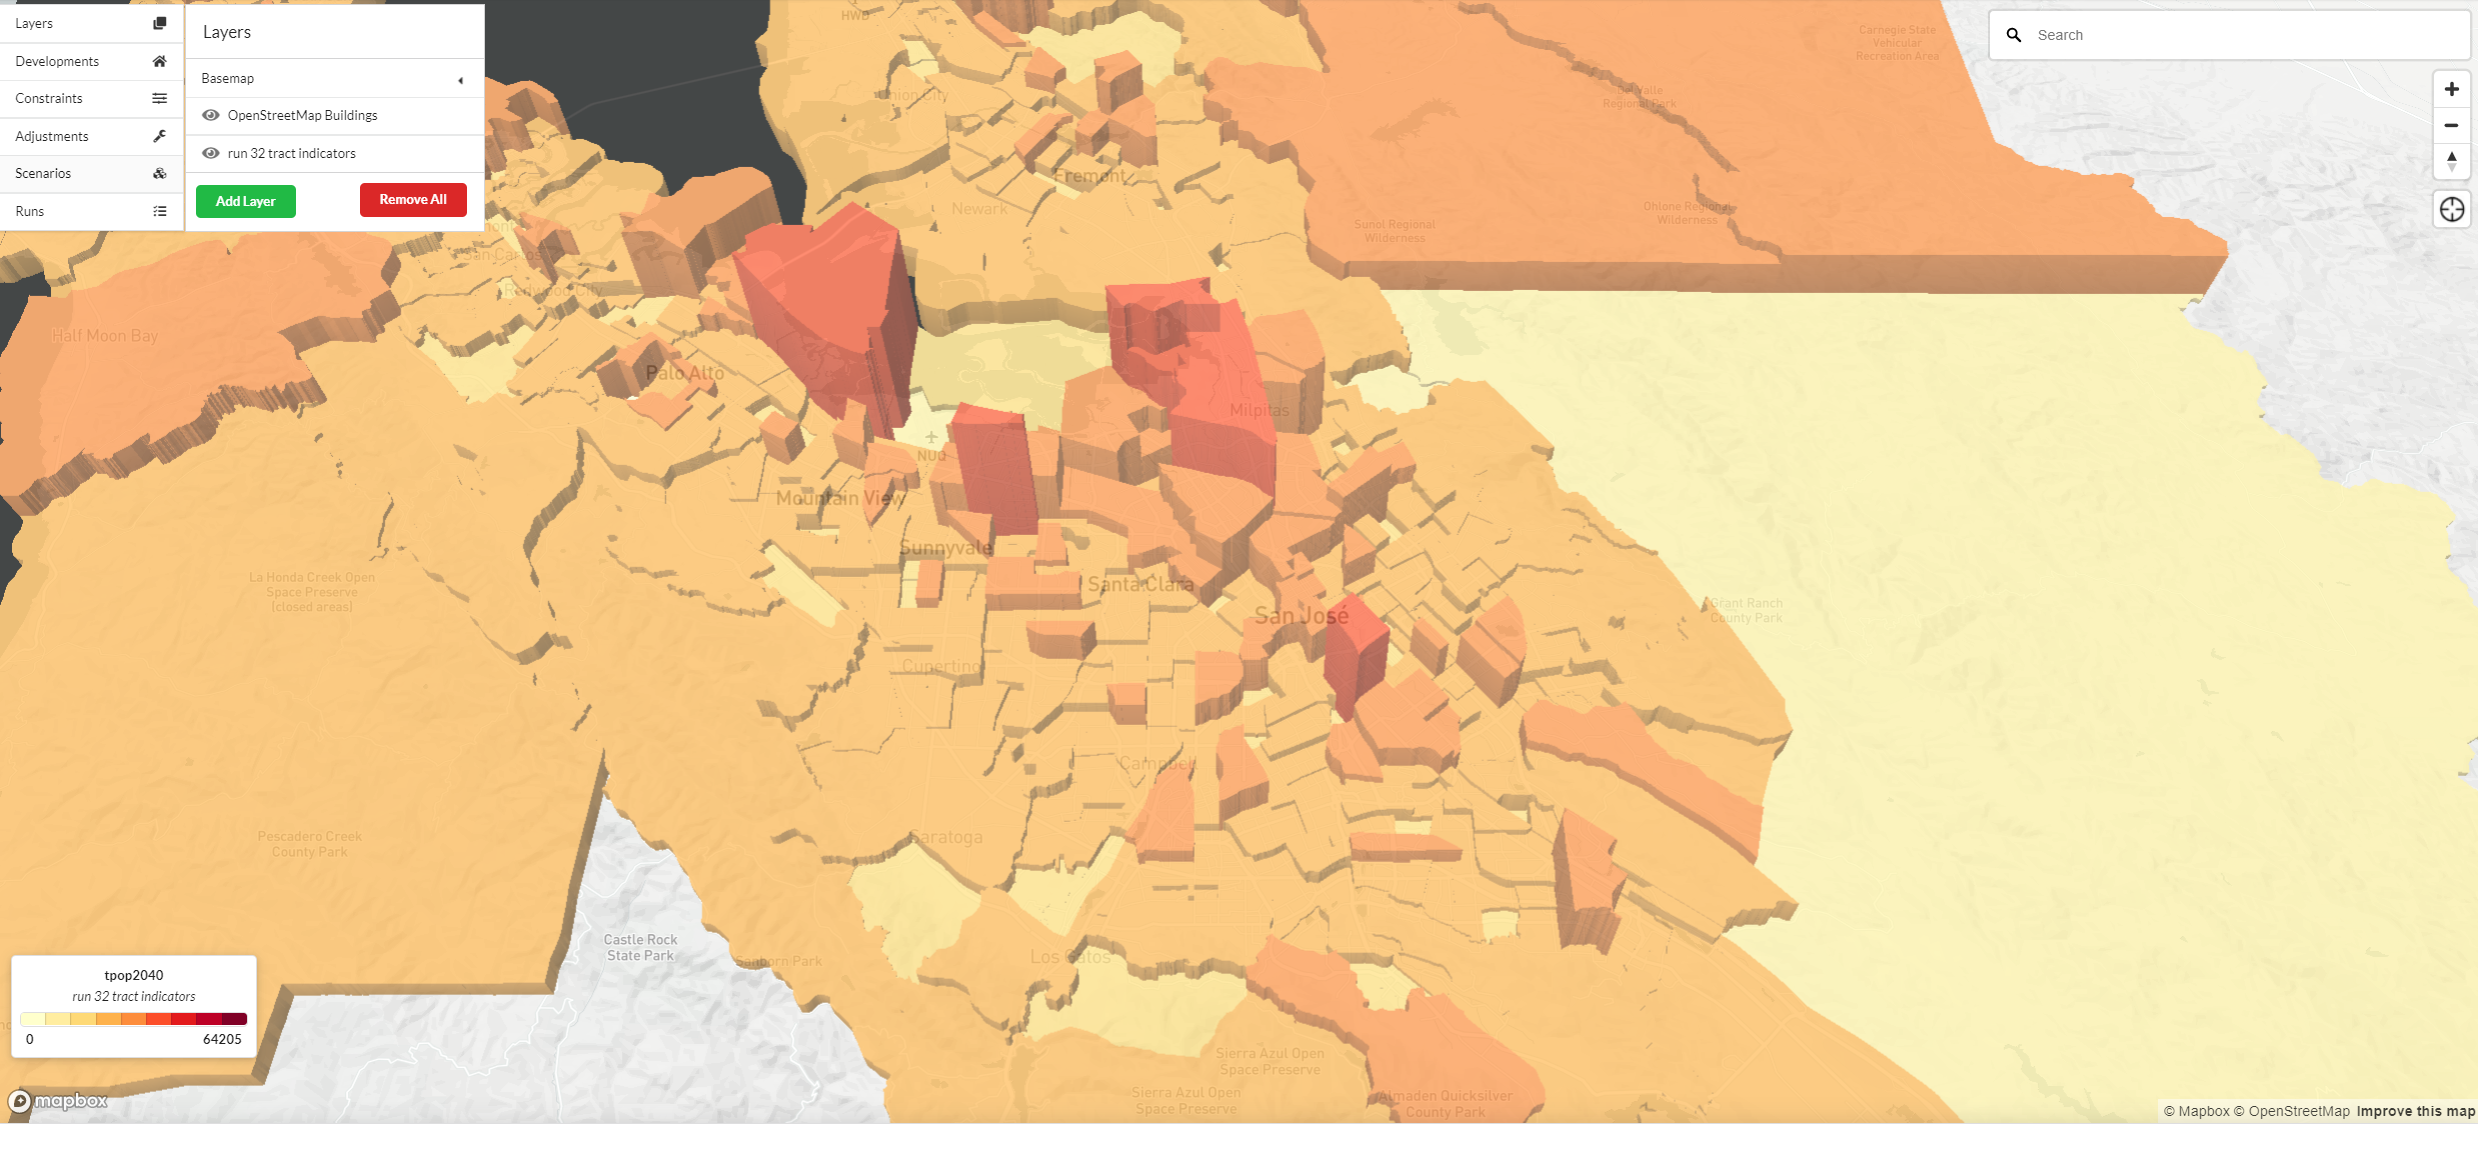
You can add multiple layers to your map by clicking on the Add Layer button. Here you can select the layer you wish to visualize by scrolling through the list of available layers, including indicator results from simulation runs, or you can filter the list by using the search function. To turn layers on and off in your map view click on the eye icon next to the layer you wish to turn on and off. To remove a layer from your map, place your mouse cursor over the layer and click on the trash icon. To edit the display properties of a layer on your map, place your mouse cursor over the layer and click on the edit icon.
Layers generated from uploads can be renamed or deleted from the uploads page at anytime.
For more on the map user interface including searching the map using an address or base data geometry ID and querying layer attributes click here.
Symbology
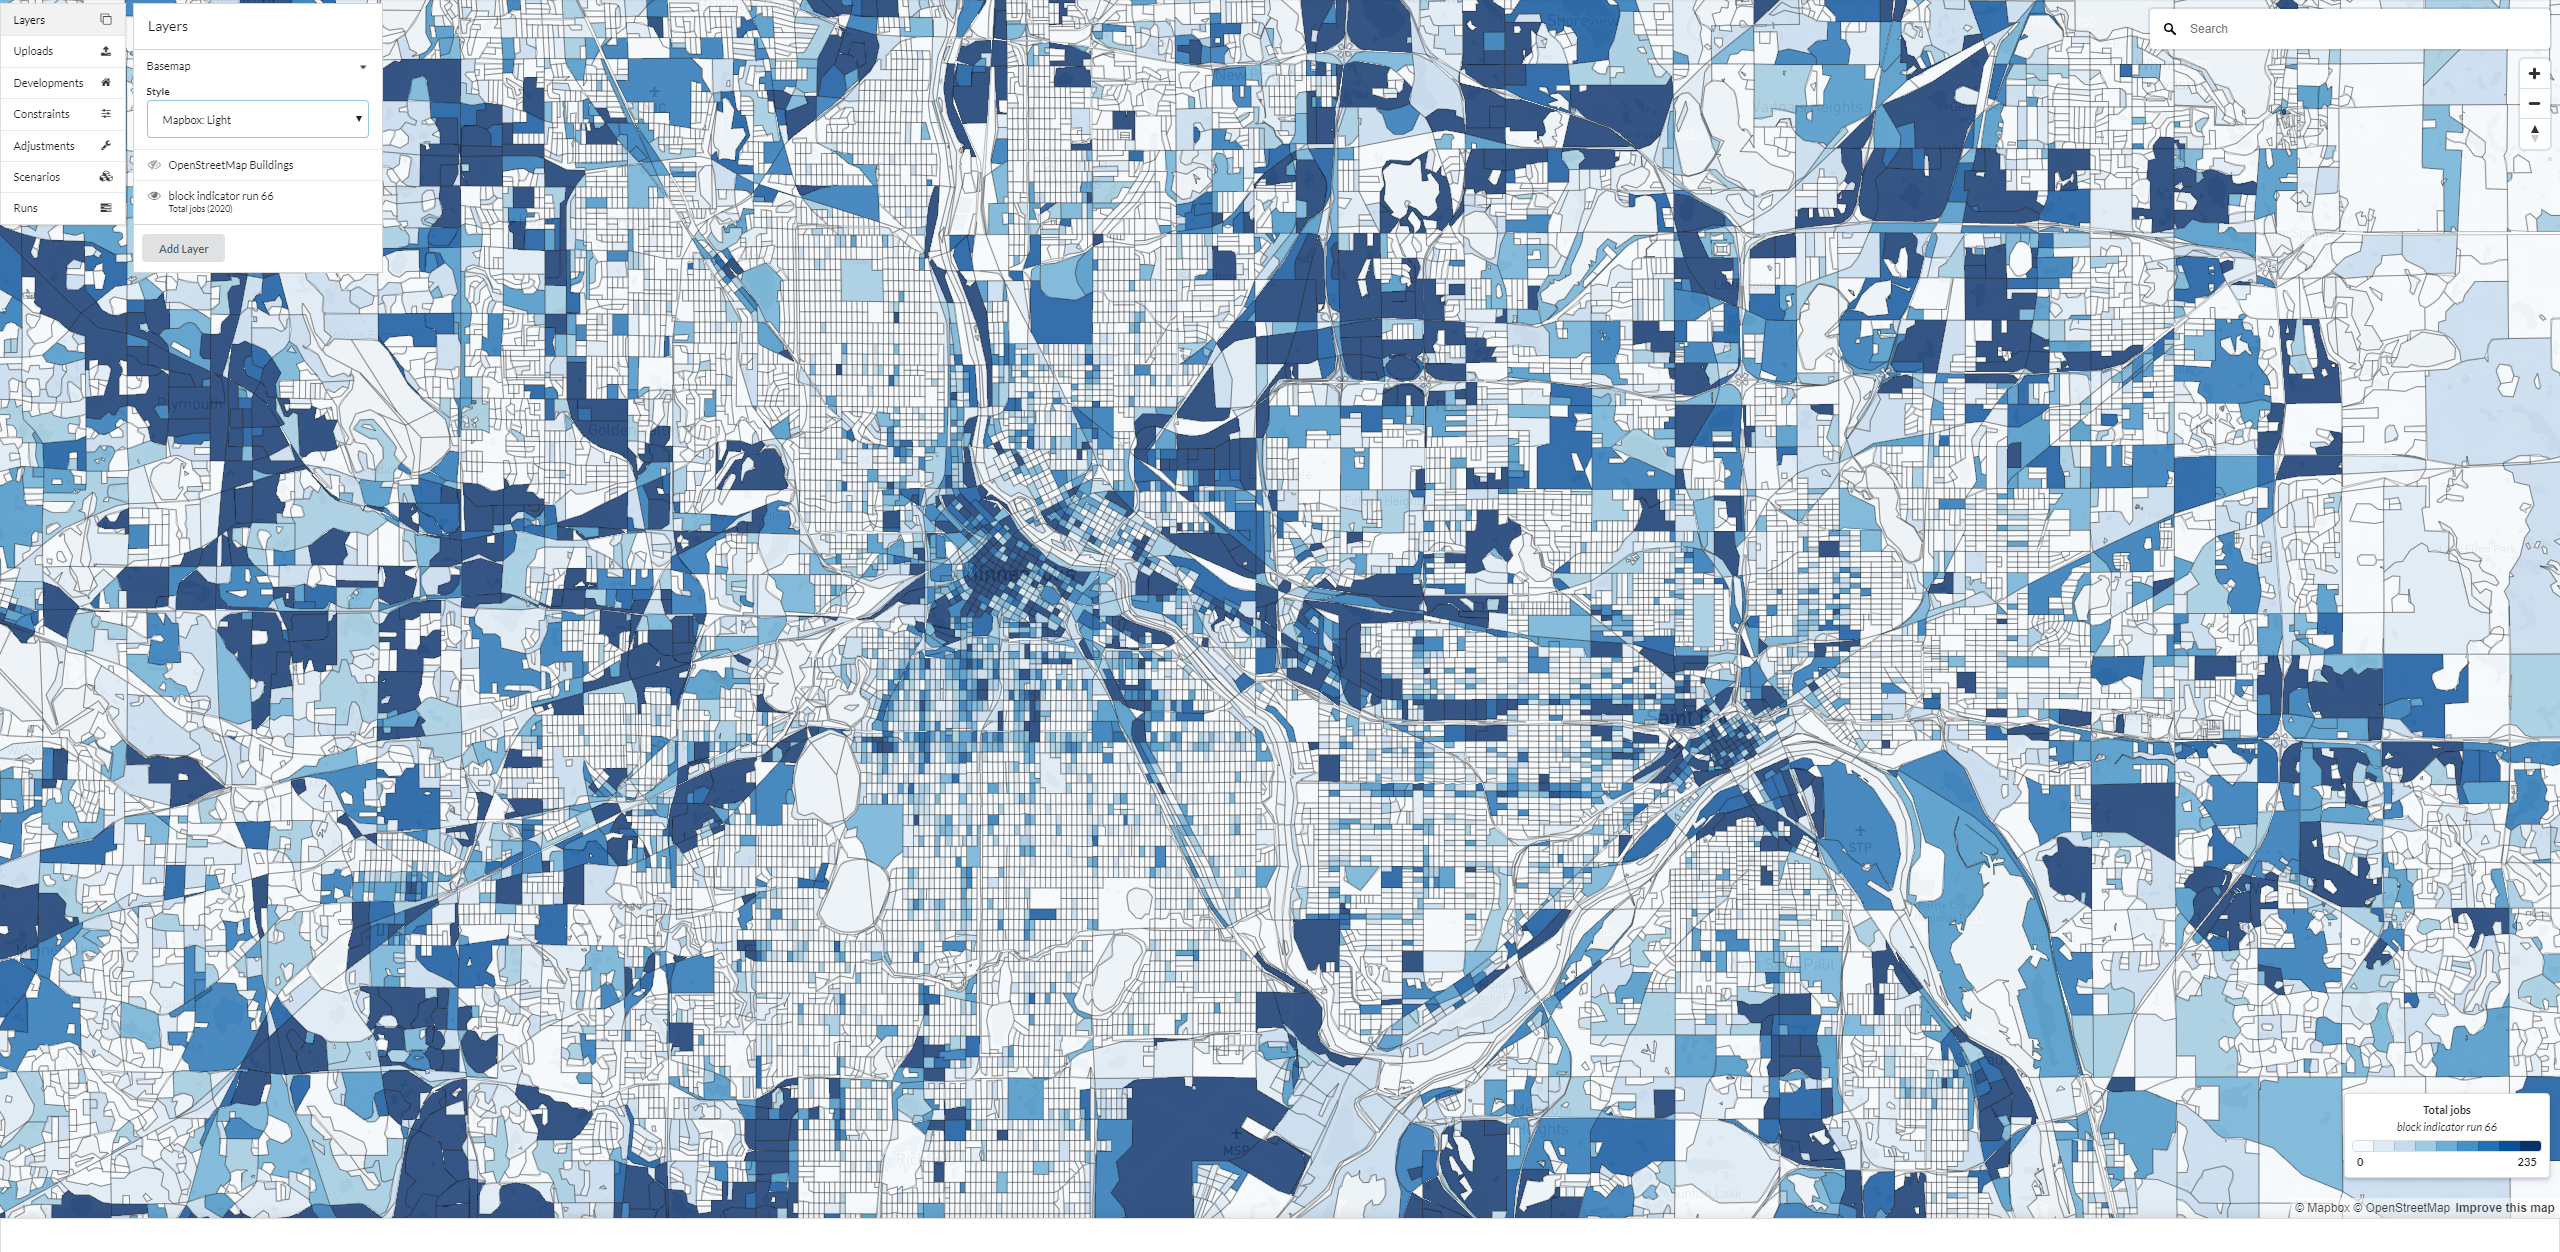
The representation of data in a map layer can be changed by setting the layer symbology. You have the option to set the symbology type after selecting a new layer to add to the map or when editing an existing layer. Data inside of map layers can be symbolized using the following symbologies: simple, quantities, and categories. Choropleth maps can be created using quantities or categories symbology options.
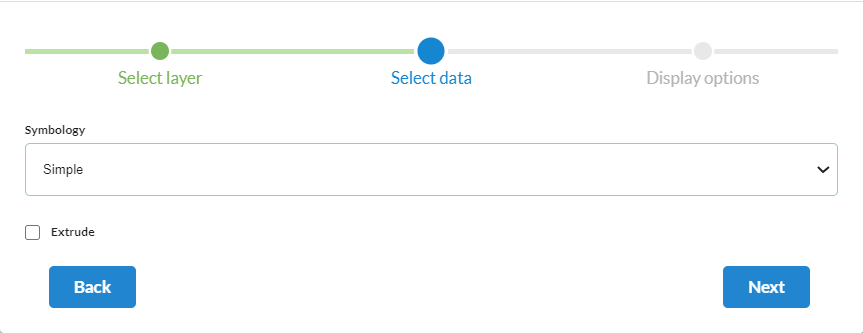
Simple
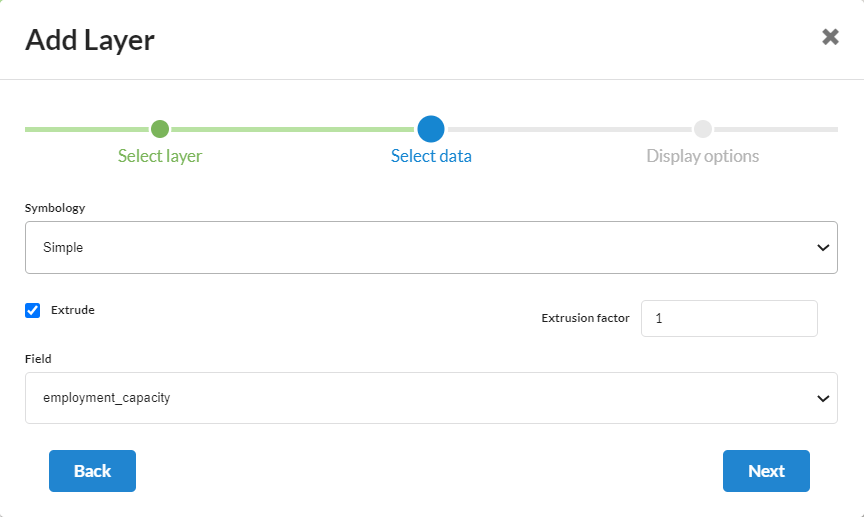
The simple symbology styles all features in a layer using a uniform color. This symbology is useful for representing simple feature extent and location. You can also extrude layers using the simple symbology and picking a field and extrusion factor to extrude by, where all features will be extruded using the same color. Note: If a column has all Null values, it will not be listed in the field dropdown list.
Quantities
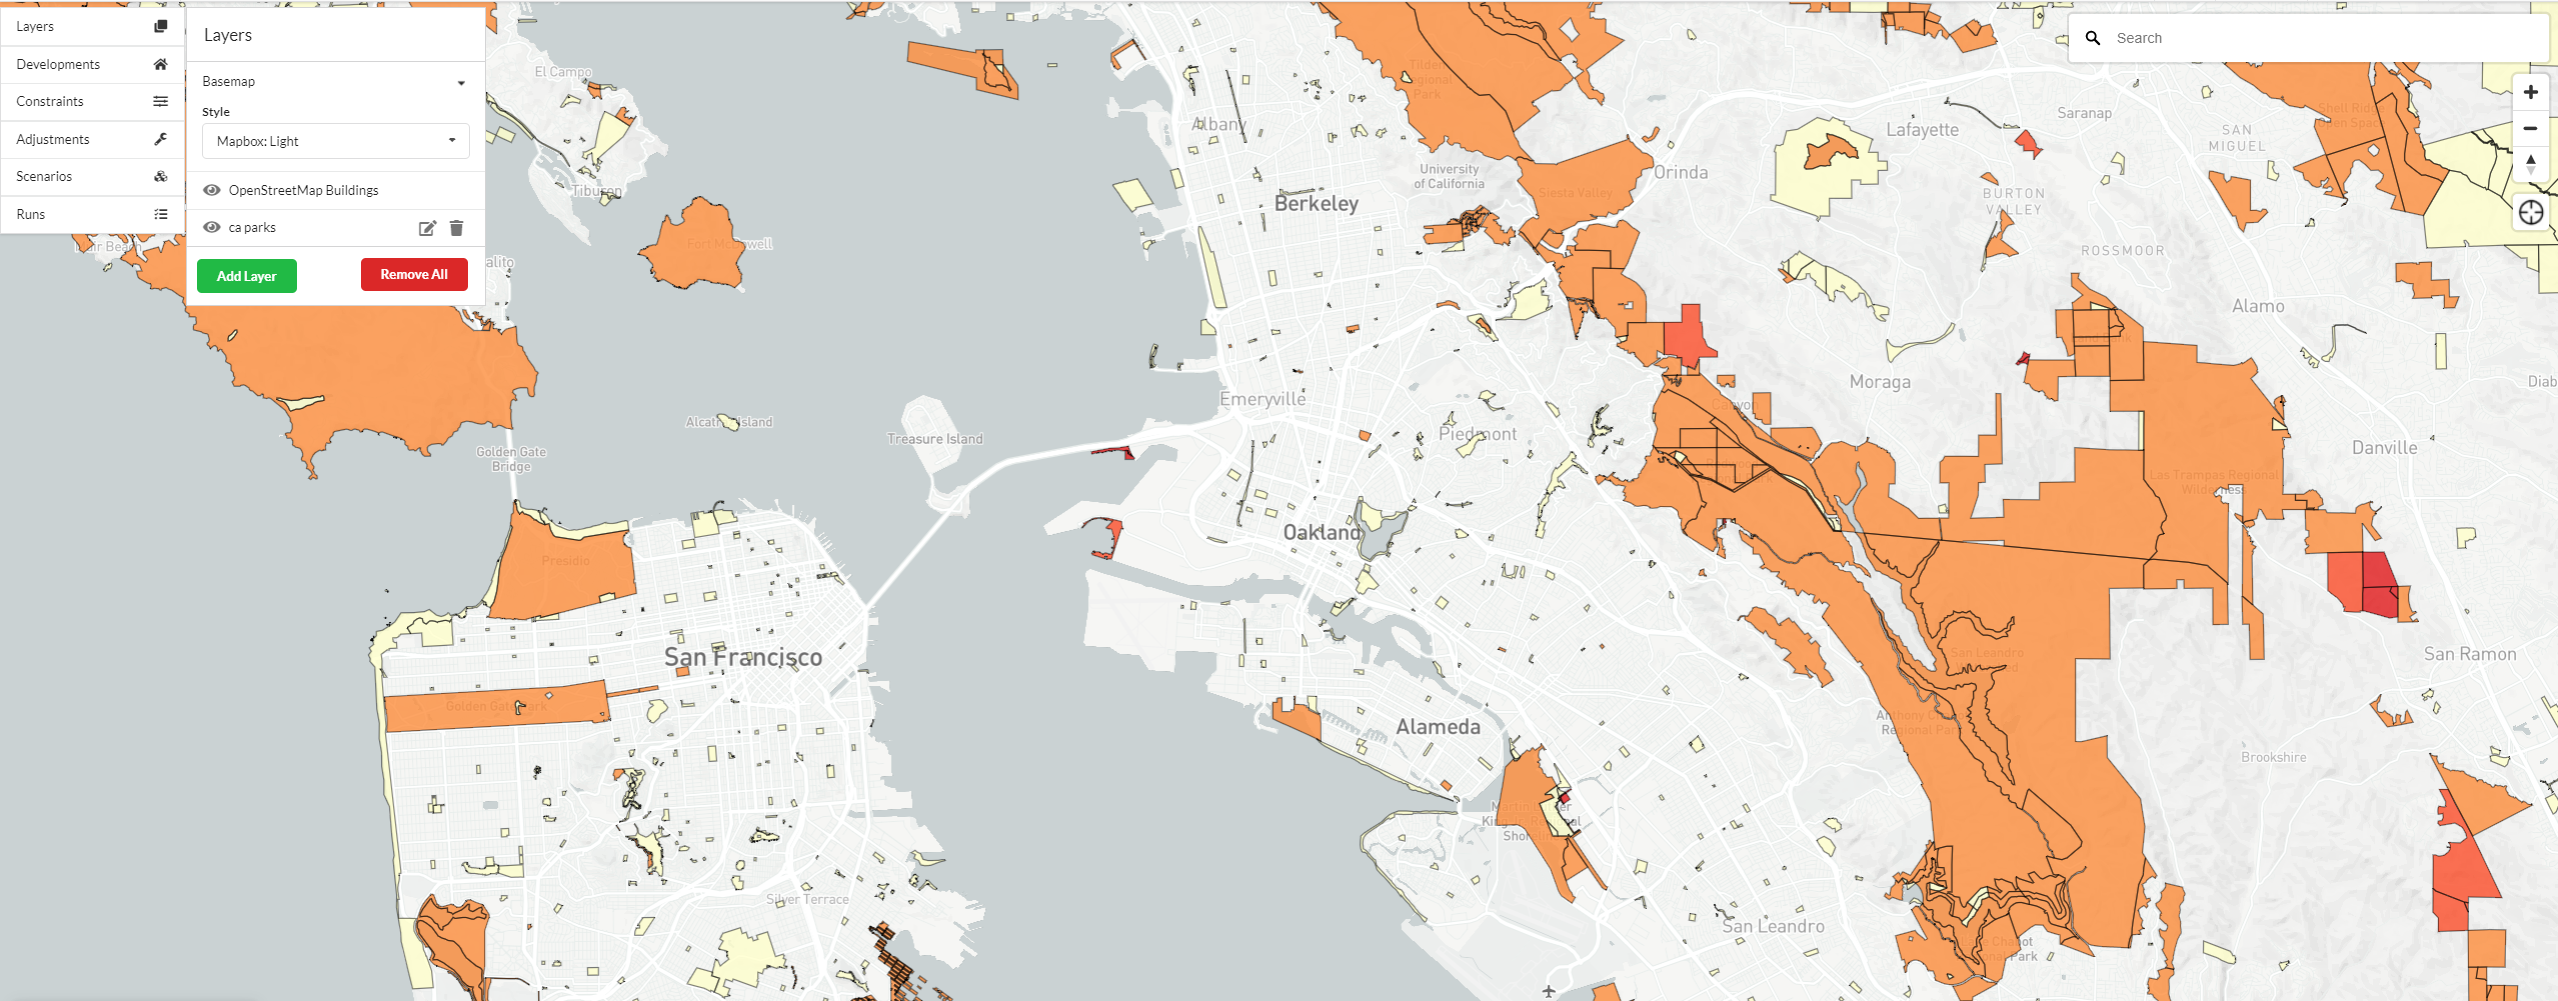
The quantities symbology styles features in a layer using a range of colors. This symbology is useful for representing continuous data in layers to show differences between features. You can also extrude layers using the quantities symbology and picking a field and extrusion factor to extrude by, where all features will be extruded using a range of colors.
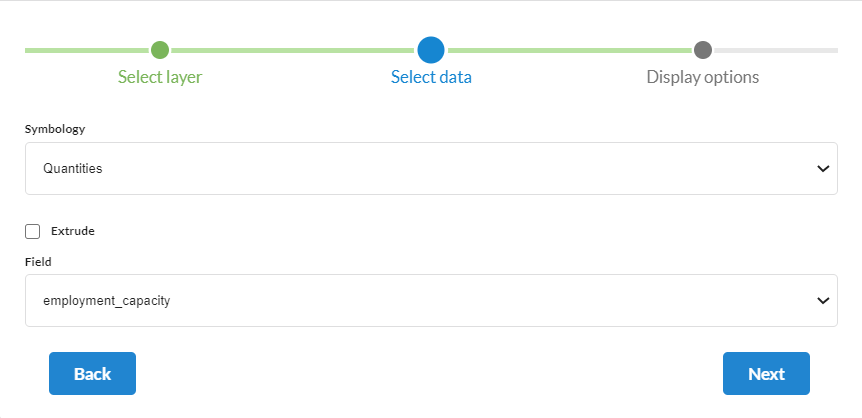
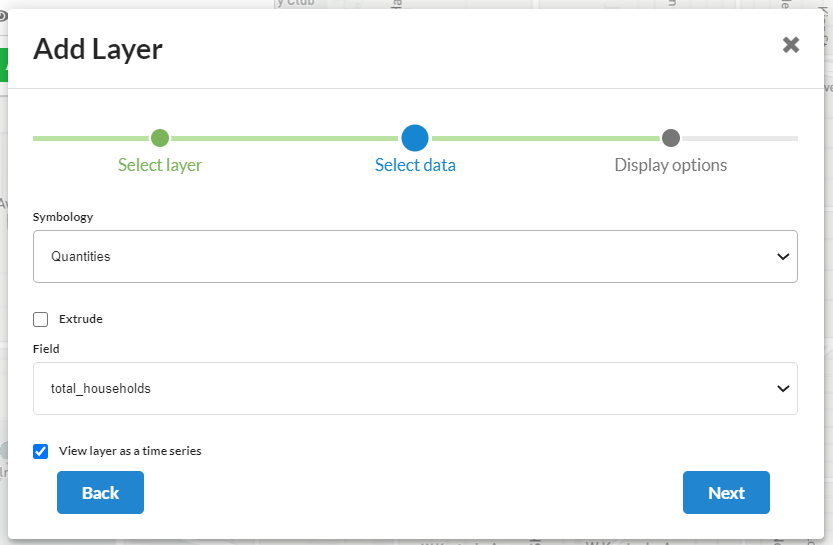
Any layer with integer or float fields can be symbolized using quantities. You must select the field in the layer to populate values with and if the layer is a time series indicator layer you can also select the year to visualize. Time series spatial indicator layers can also be visualized using the time slider by clicking on the View layer as time series option. See the time slider section for more information. Note: If a column has all Null values, it will not be listed in the field dropdown list.
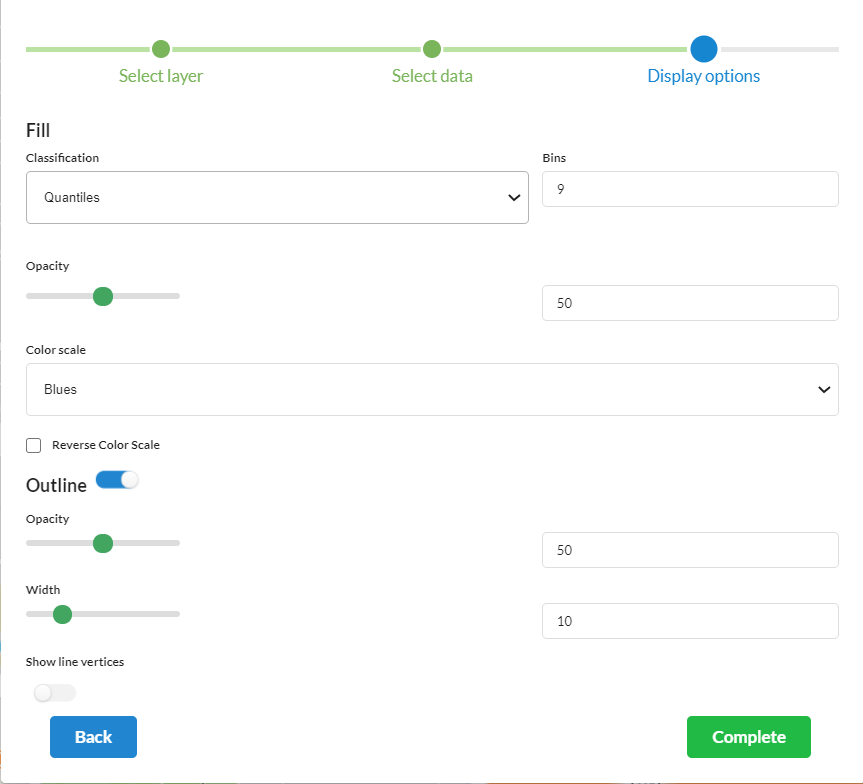
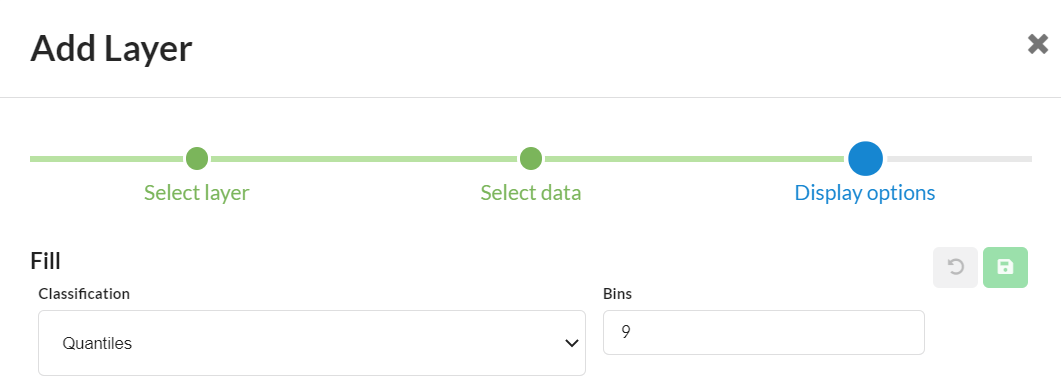
Once the values to visualize are set, you can choose a method to bin the distribution of values and the number of bins to use. Currently, values can only be binned using quartiles. A number of simple or diverging color ramps are available to choose from to display the bins of values.
Categories
The categories symbology styles features in a layer using a range of colors based on data in a field. This symbology is useful for representing categorical data in layers to group features by similar values. Note: If a column has all Null values, it will not be listed in the field dropdown list.
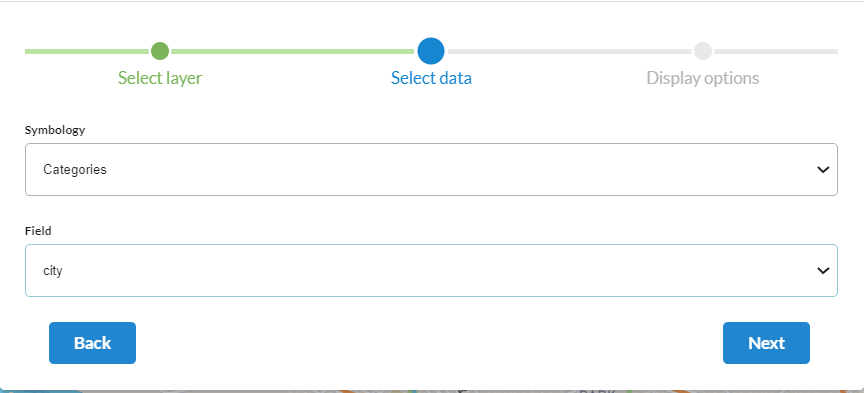
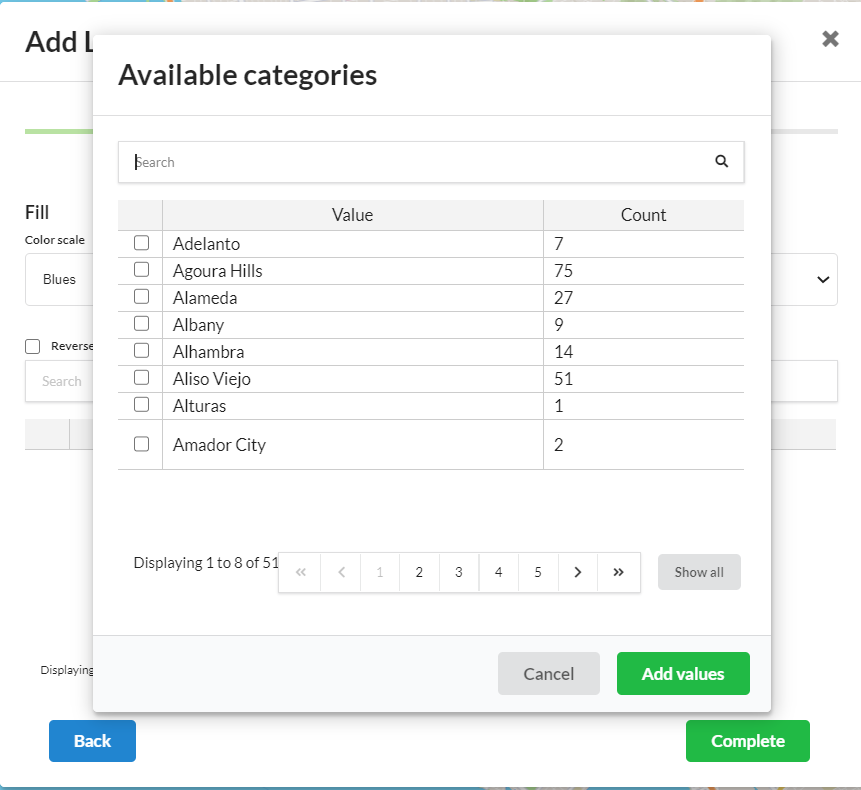
Any layer with string fields can be symbolized using categories. At this time, integer and float fields cannot be used. Once the field in the layer to populate categories for has been selected, you can populate specific values to use as categories by clicking either: 1) Add all values to add all unique values in the field as categories; or 2) Add values to open an interface to search and select a more narrow set of values to use as categories. Only the categories selected from the layer will be displayed on the map, categories not selected will be hidden.
Note
Currently only 1,000 categories can be viewed in a single layer. If your layer has more than 1,000 categories use the Add values option to select a subset of categories to use.
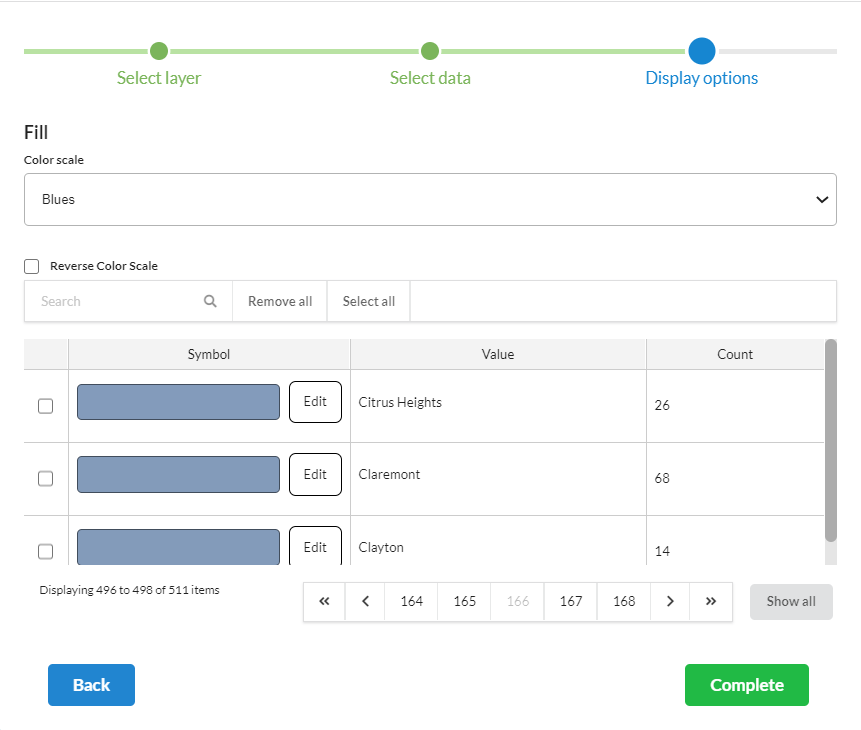
Once a set of categories have been selected, the categories can be symbolized using either: 1) a simple or diverging color ramp to apply to all categories or 2) a sub-selection of categories to apply specific color fill and or outline settings for.
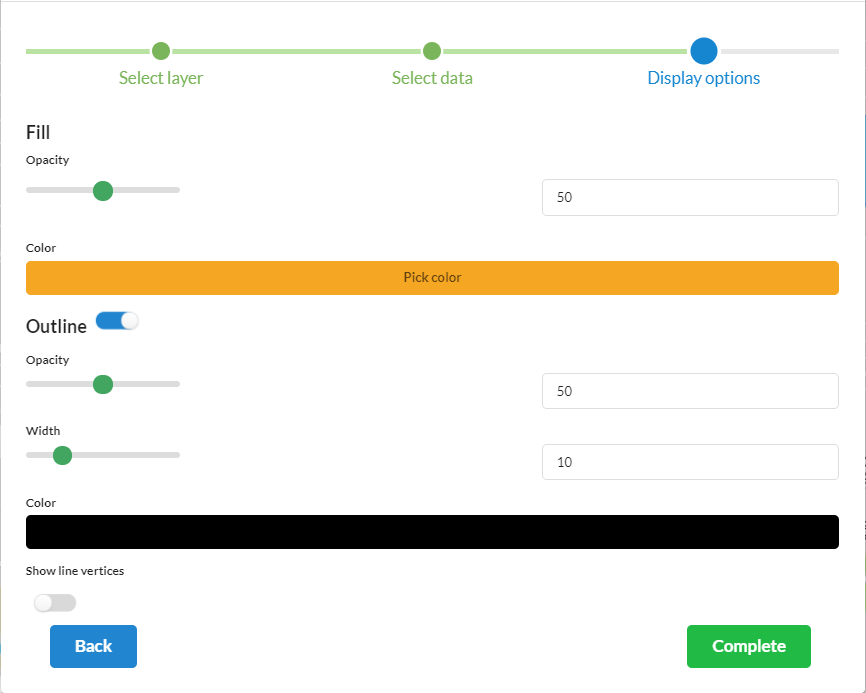
Layer display options
Map layer symbols can be further configured by changing the layer display settings summarized below:
General:
Color scale: Simple or diverging color ramps to apply to a range of values in a feature.
Reverse color scale: Toggle on to reverse the selected color scale.
Color fill: Choose a uniform color to fill a feature.
Opacity: Set the level of layer transparency from 0 (fully transparent) to 100 (fully opaque).
Show line vertices: Toggle on to view polygon or line vertices as points.
Points:
Size: Change the size of points.
Lines:
Width: Change the width of lines.
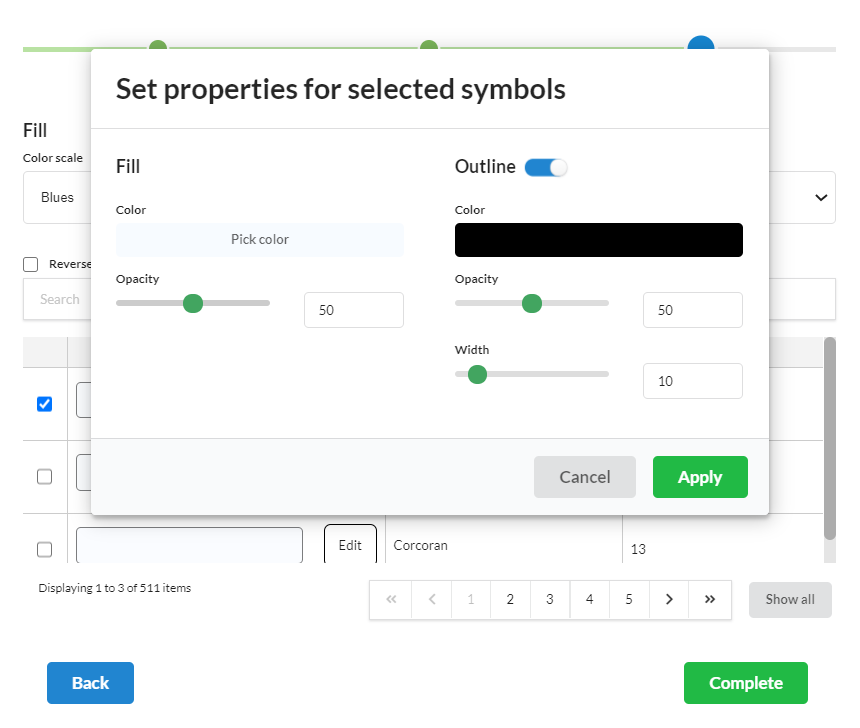
Polygons:
Outline: Polygon outlines can be turned off and on and styled:
Opacity
Width
Color fill
Default symbology
By default, all layers have a standard set of default symbology settings already applied to them when you add a layer to the map. This makes it fast and easy to visualize a layer on the map without needing to change any of the symbology settings. Administrators can choose to change and set new default symbology settings for each layer and each field within a layer for each type of symbology option (e.g. simple, quantities, and categories). To change the default symbology for a layer’s field for a specific symbology type, an administrator can add a new layer or edit an existing layer, pick the symbology type (e.g. simple, quantities, and categories), pick the field, and then in the display options tab set the desired display options and click the green save button ![]() in the upper right hand corner of the display options tab to save the settings. To revert the settings back to what they were before, click the grey revert button located next to the save button
in the upper right hand corner of the display options tab to save the settings. To revert the settings back to what they were before, click the grey revert button located next to the save button ![]() . Administrators can change the existing defaults for a layer at anytime. When other users associated with your account add layers to the map that an administrator has set a default symbology for, those layers will have the default symbology settings applied. Depending on the user’s UrbanCanvas role permission level, those users will still be able change the symbology of those layers. Administrators can use this feature to make it easier for non-technical users to be able to quickly and easily visualize layers without needing to set symbology settings or to simply set layers that are used often to always have the same symbology saving time.
. Administrators can change the existing defaults for a layer at anytime. When other users associated with your account add layers to the map that an administrator has set a default symbology for, those layers will have the default symbology settings applied. Depending on the user’s UrbanCanvas role permission level, those users will still be able change the symbology of those layers. Administrators can use this feature to make it easier for non-technical users to be able to quickly and easily visualize layers without needing to set symbology settings or to simply set layers that are used often to always have the same symbology saving time.
Time slider
Time series indicator layers, including exported simulation spatial indicators and manually uploaded ad-hoc indicators, can be styled using the quantities symbology and have the ability to be visualized in the time slider.
To view a time series indicator layer using the time slider, once the field to visualize is selected, select the view layer as time series option and set the layer symbology. Optionally, you can use the Use min and max value of time series option to normalize the values in the time series across all time points. This will set the distribution of values in the time series to be consistent over time by using the min and max of the values in the selected field for the entire time series. Both 2D and 3D extruded layers can be visualized using the time slider. Only time series layers with more than one year can be used with the time slider.
The time slider panel will be visible to the right of the layers panel. This panel can be moved around the screen, minimized, and closed. The panel has a drop down menu of all layers you have set to view as a time series and allows you to quickly switch between different layers in the time slider. The panel offers the same functionality as the layers panel with options to edit an individual layer’s symbology or remove a layer from the time slider.
Each time point in the time series is displayed as a tick mark on the time slider line. Dragging the marker back and forth across each tick on the line updates the data shown on the map for the specified year. Clicking once on the time slider line in front of or behind the current year marker will increment the time slider forward or backward one time point, respectively.
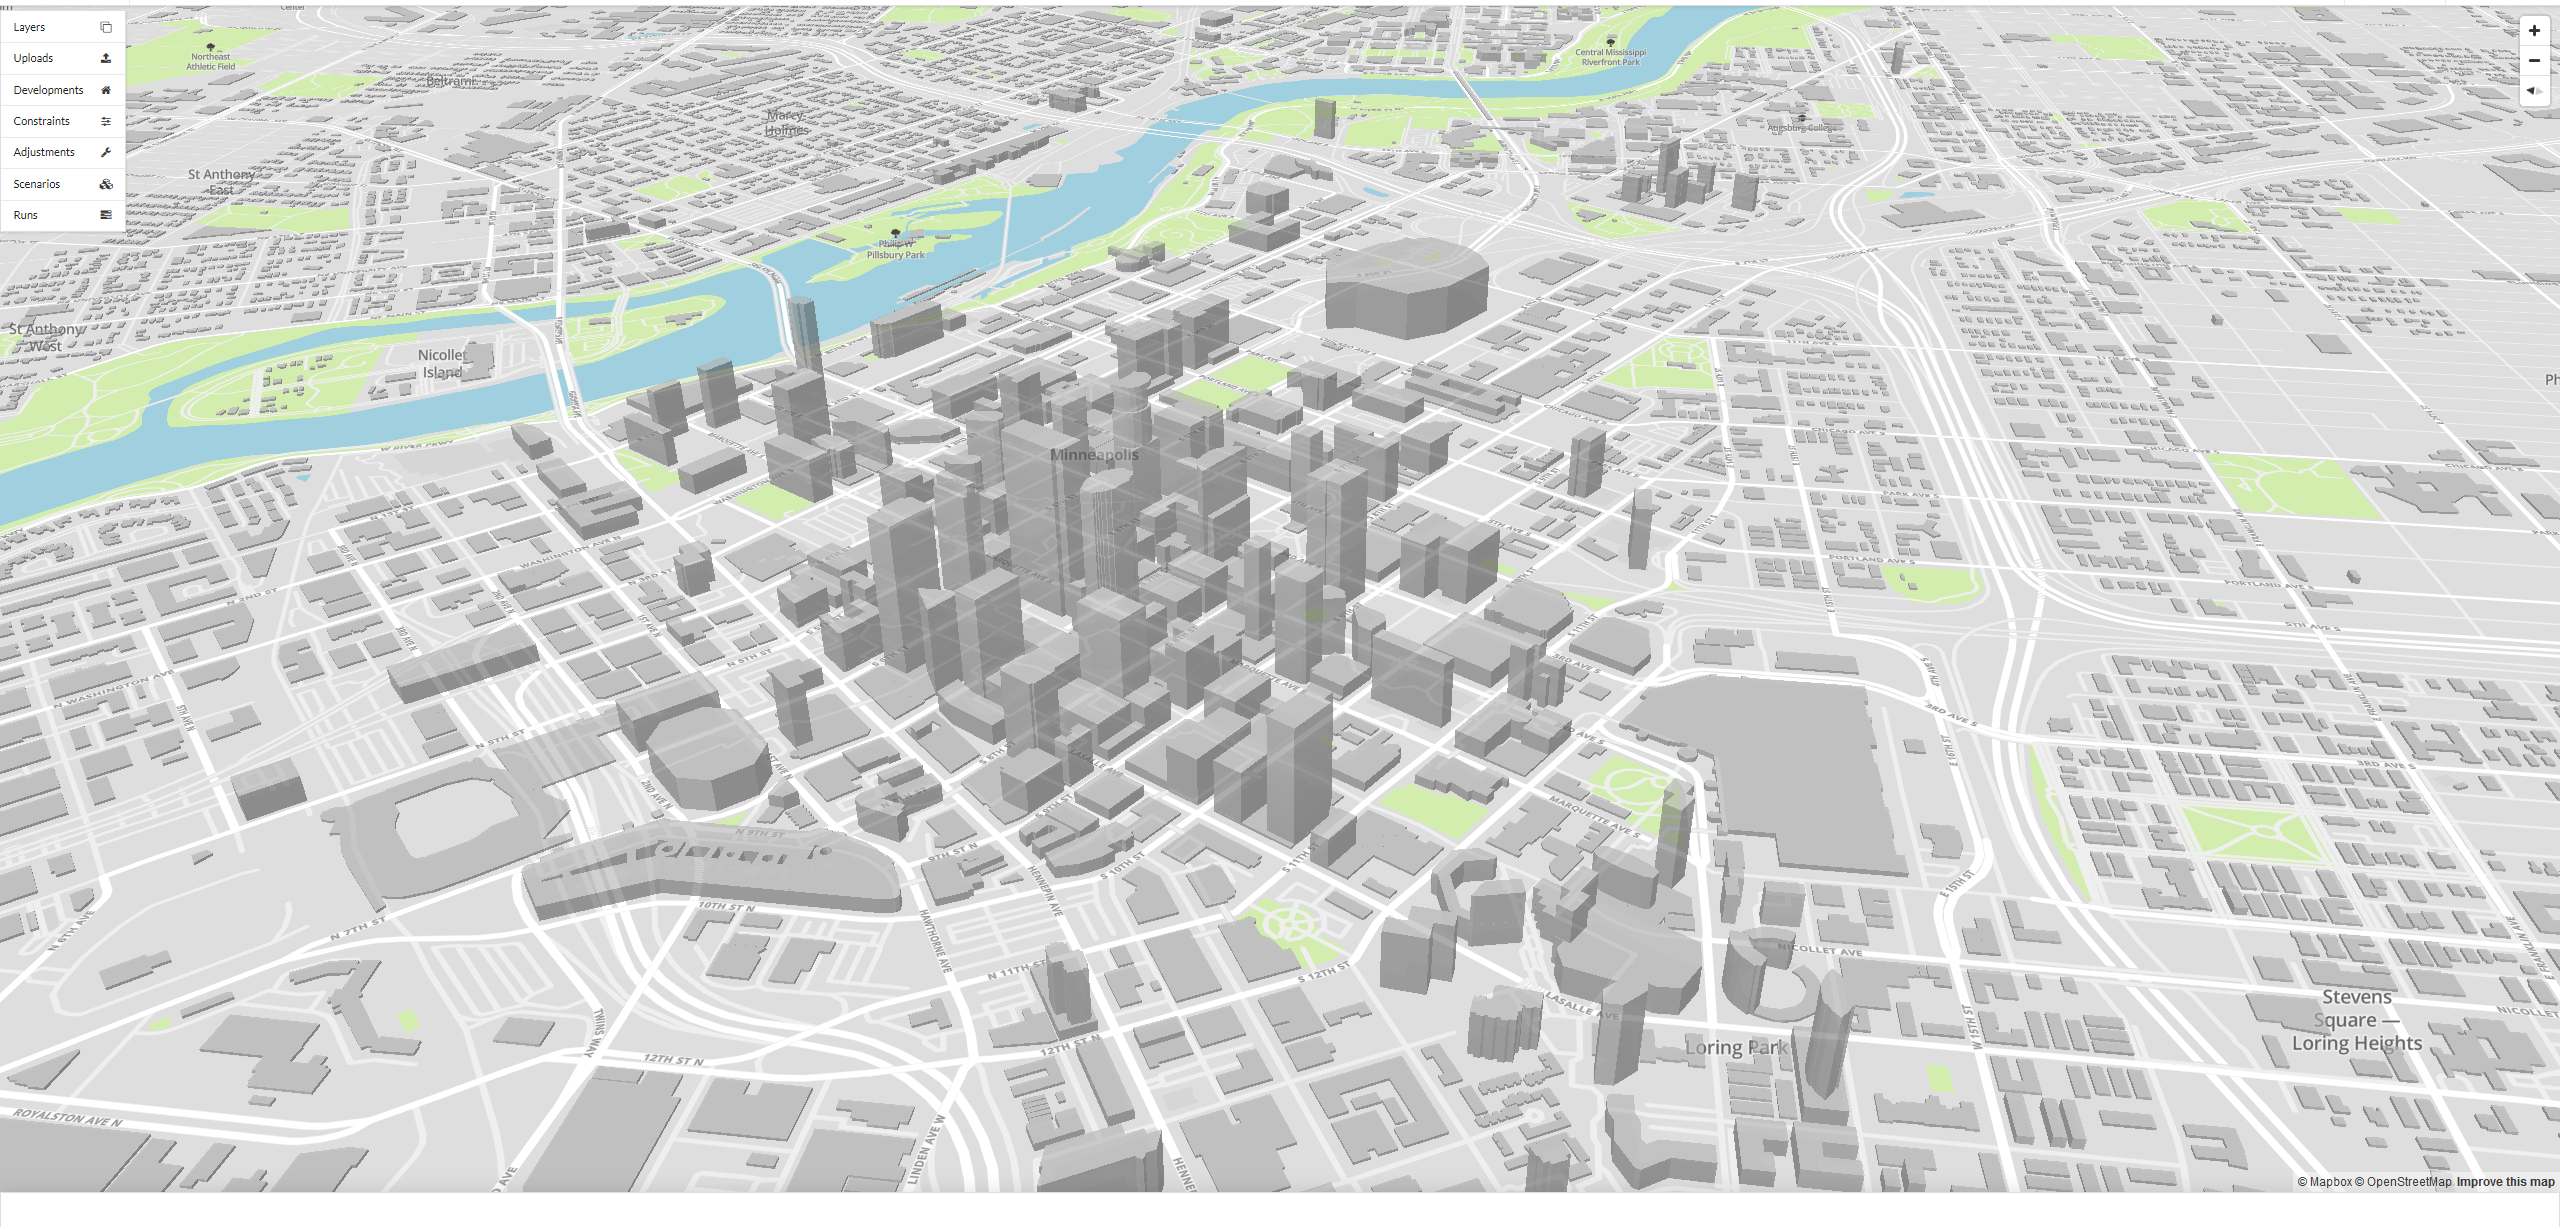
3D extrusion
Polygon layers can be extruded on the 3D map by turning on the extrude option for the layer. Select a field to use as the values to extrude by and an extrusion factor to apply. The extrusion factor will multiply the values in the field to generate the height of each polygon. Currently, extrusion is not supported for point and line layers. Note that the extrusion feature works by interpreting the values you are extruding in units of meters to build the height of the extruded feature on the map. It is suggested When extruding extreme low or high values that you use an extrusion factor to manipulate the height of the extrusions.
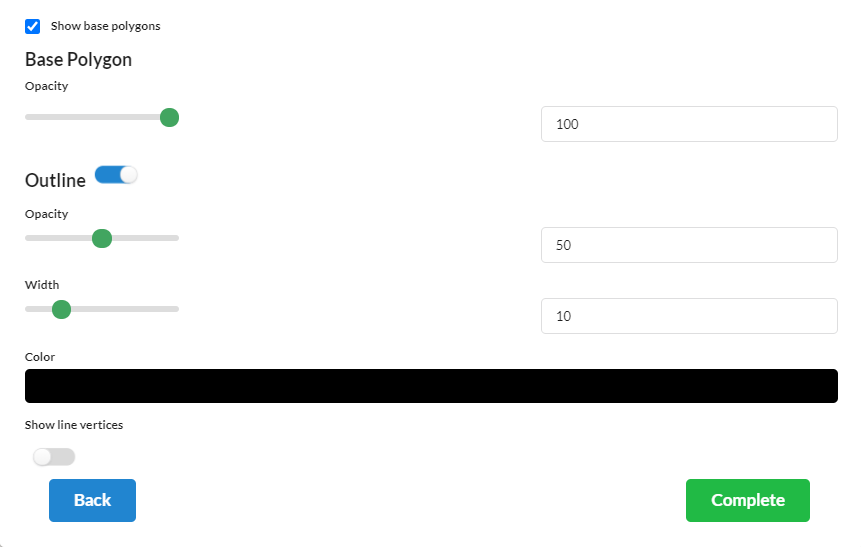
Extruded layers can be further customized by turning on the Show base polygons option. This will turn on the polygons that comprise the base of the extrusion. Options are available to change the base polygon opacity and outline opacity, width, and fill color. The base polygon can be queried on the map to examine the attributes of the extruded layer.
UrbanSim default map layers
By default, the layers menu includes:
OpenStreetMap building footprints (coverage depends on data availability)
The base geometry data utilized by your model (e.g. Census blocks, parcels, or zones)
A standard set of basemaps
Indicators for base year conditions
Note
OpenStreetMap (OSM) data are comprised of community edited, and in some cases local and state government edited, spatial data that are continuously updated. OSM building footprints represent OSM user created data and should not be considered a complete authoritative data source.
The following default map layers are available depending on your model type and location:
Layer Name |
Description |
Source |
|---|---|---|
Parcel |
Parcel geography uploaded for |
User upload |
Zone |
Zone geography uploaded for |
User upload |
2010 Census Blocks** |
2010 Census Blocks |
US Census |
2010 Census Block Groups** |
2010 Census Block Groups |
US Census |
2010 Census Tracts** |
2010 Census Tracts |
US Census |
2010 Census Designated Places** |
2010 Census Designated Places |
US Census |
2010 Census Counties** |
2010 Census Counties |
US Census |
2010 Census TAZs** |
2010 Census TAZs |
US Census |
2010 Public Use Microdata Areas (PUMA)** |
2010 Public Use Microdata Areas (PUMA) |
US Census |
2006 Dissemination Area*** |
2006 Dissemination Area |
Statistics Canada |
2011 Dissemination Area*** |
2011 Dissemination Area |
Statistics Canada |
2016 Dissemination Area*** |
2016 Dissemination Area |
Statistics Canada |
2006 Census Tract*** |
2006 Census Tract |
Statistics Canada |
2011 Census Tract*** |
2011 Census Tract |
Statistics Canada |
2016 Census Tract*** |
2016 Census Tract |
Statistics Canada |
*Optional, only generated when specified in a simulated scenario
**Only available by default to users in the US
***Only available by default to users in Canada
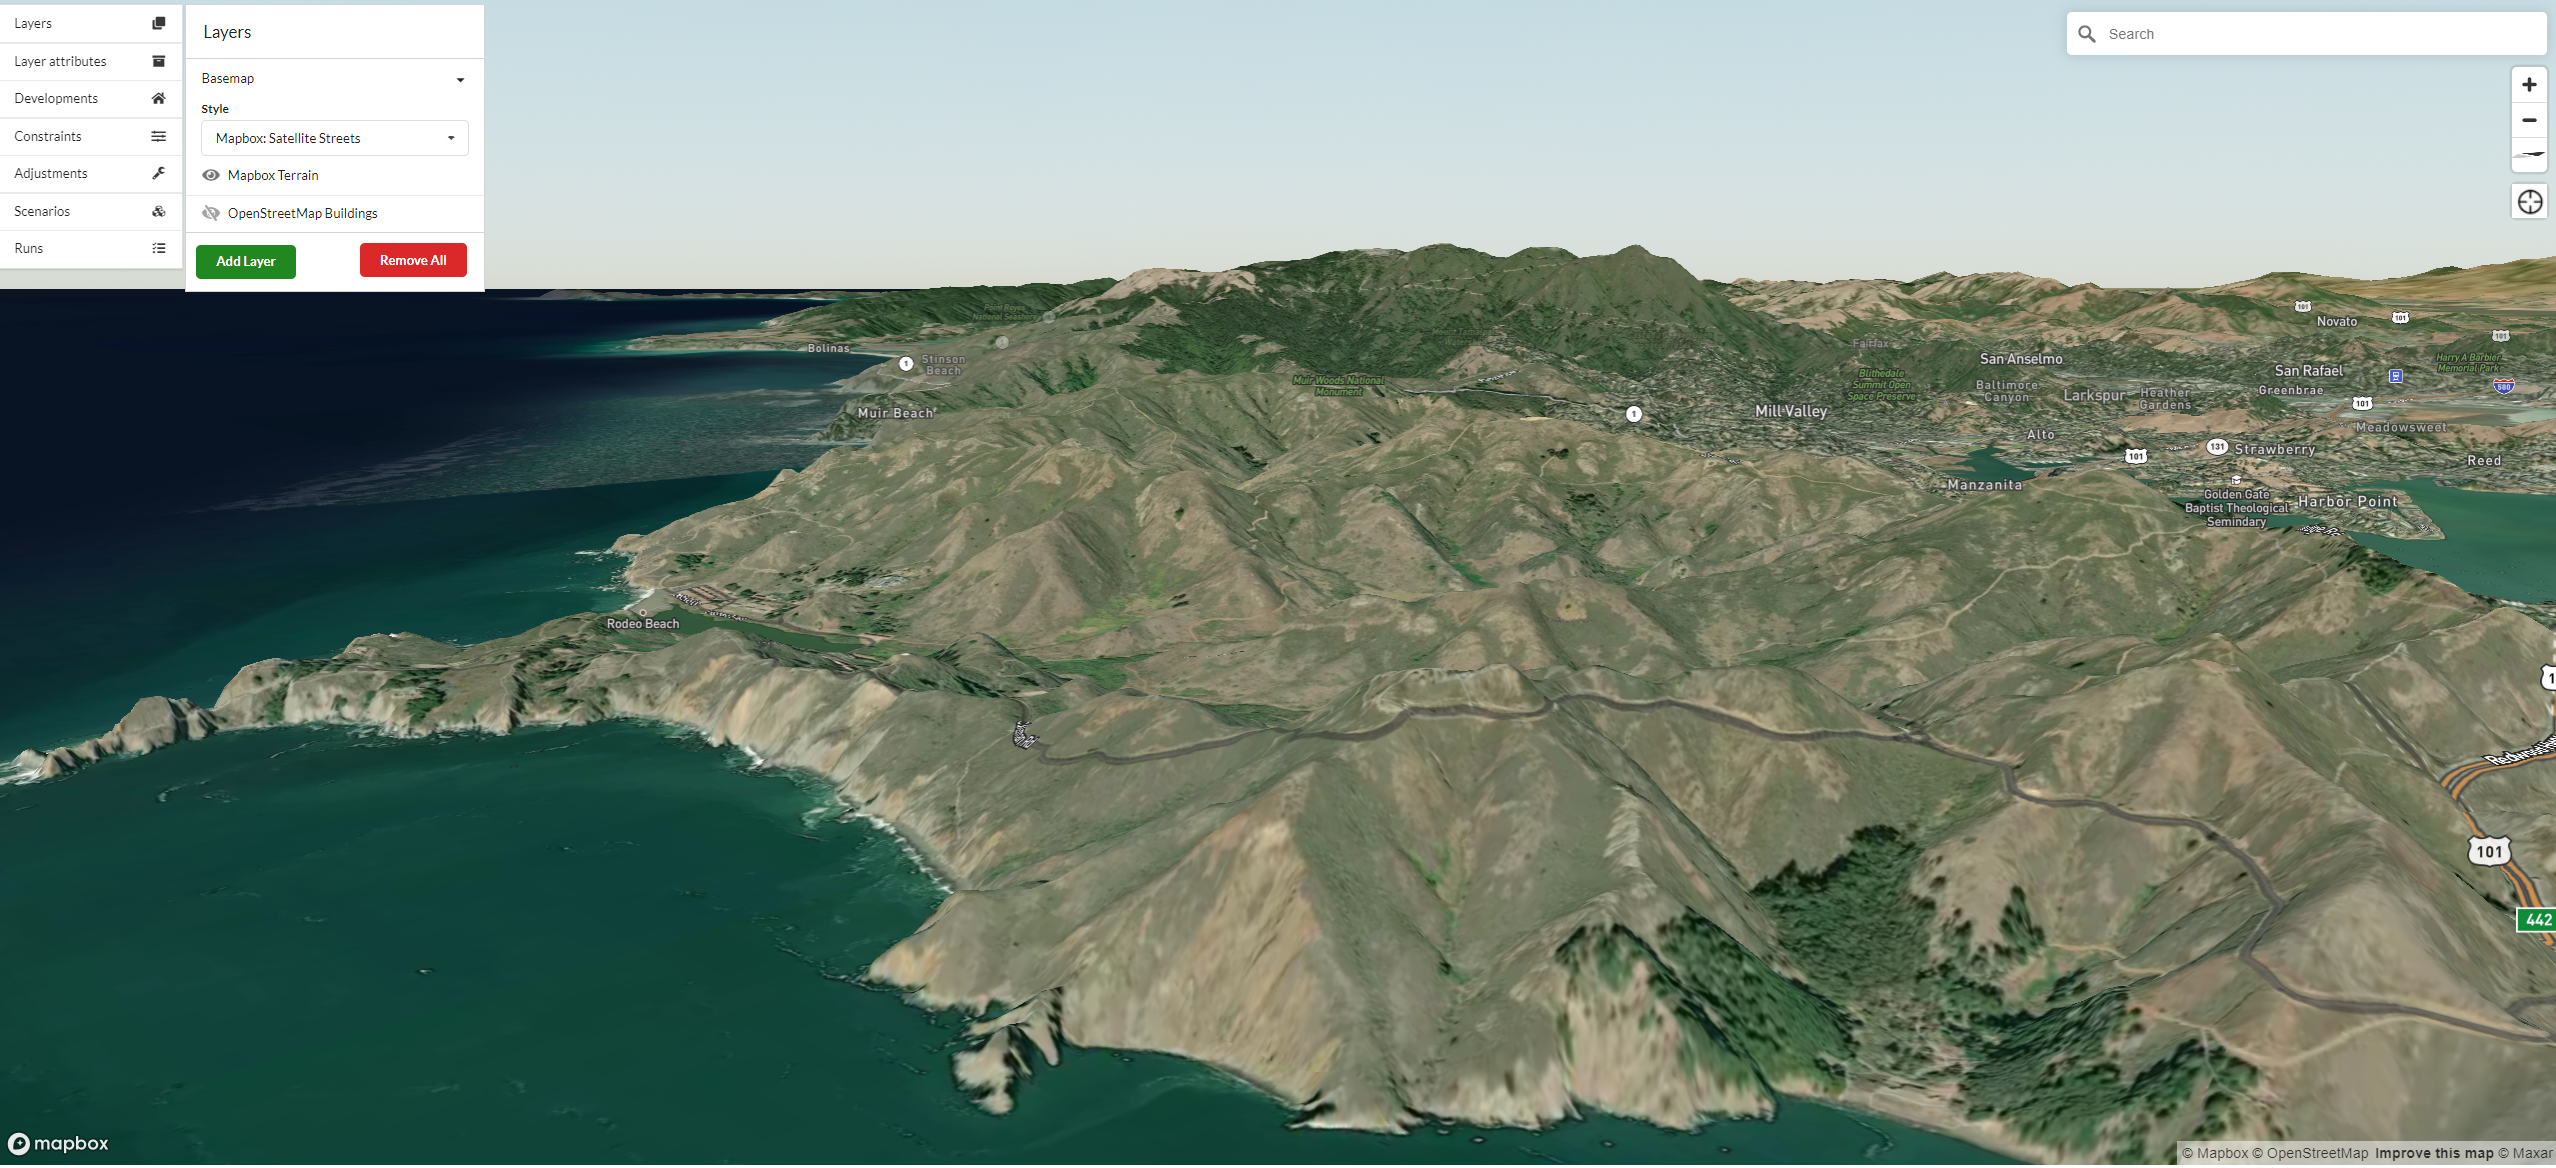
Basemaps
The Basemap selection drop-down appears as the first layer in the layers window. When expanded, it includes a set of maps and aerial imagery to select as backgrounds.
Terrain
Inside of the Basemap section of the layers panel, there is an option to turn on Mapbox Terrain which is 3D terrain data created by Mapbox comprised of government and commercial datasets. When turned on, the basemap and any map layers on the map will be draped over 3D terrain to provide greater topographical context.
Notes
The layers listed in the add layer list are sorted by default in reverse chronological order with the most recently added layers displayed first. This helps to quickly identify new uploaded layers and new indicators.
Currently, the z-order of map layers cannot be changed in the UI. Layer z-order is derived in reverse chronological order where the latest map layer that was added to the map will be displayed on the map on top of older layers with the oldest displayed on the bottom. The active map layer list shows layers in chronological order with the latest map layer that was added to the active map layer appearing at the bottom of the active map layer list.