Data Overview
The UrbanSim parcel-level model template operates at the parcel level of geography. The core data in this model template are:
Parcels:
Each of these core datasets can be constructed as part of a consulting contract between UrbanSim and the parcel-level UrbanCanvas Modeler subscriber. Subscribers are encouraged to prepare their spatial and tabular regional parcel, zoning, and building data in advance.
In the parcel-level model, each household and job (or establishment) is assigned to a building record, and each building is associated with a parcel record. There can be multiple buildings on a parcel (a many to one relationship between buildings and parcels). The parcel-level UrbanSim model template is the most disaggregate and behaviorally-explicit version of the model system.
The parcel-level model simulates the addition and/or movement of individual household and job records in the region and the construction or demolition of buildings. The households table contains one record for each household in the region and optionally can link to a persons table that contains a record for each person in a household. Employment can be represented with the jobs table that contains one record for each job in the region. Alternatively, establishments can be used in place of a jobs table that contain one record for each business establishment in the region with employee counts. Each table has a unique identifier field, a building ID field, as well as fields representing agent or building characteristics.
Each new agent introduced into the simulation is allocated to a particular building in the region using multinomial logit-based location choice models, estimated off of local data. The buildings table, which contains one record for each building in the region, is associated with a parcel record’s parcel ID which represents the base geography of the parcel template. If an optional residential units table is provided, household agents can be further disaggregated to the unit-level. When allocating agents to buildings and/or units, rent and price is often a key explanatory variable, and price models can be estimated using rent or price datasets that the user has uploaded.
Because the simulation operates at the parcel-level, model output can be summarized at any geography at the parcel level or coarser (e.g. any Census geography or zones).
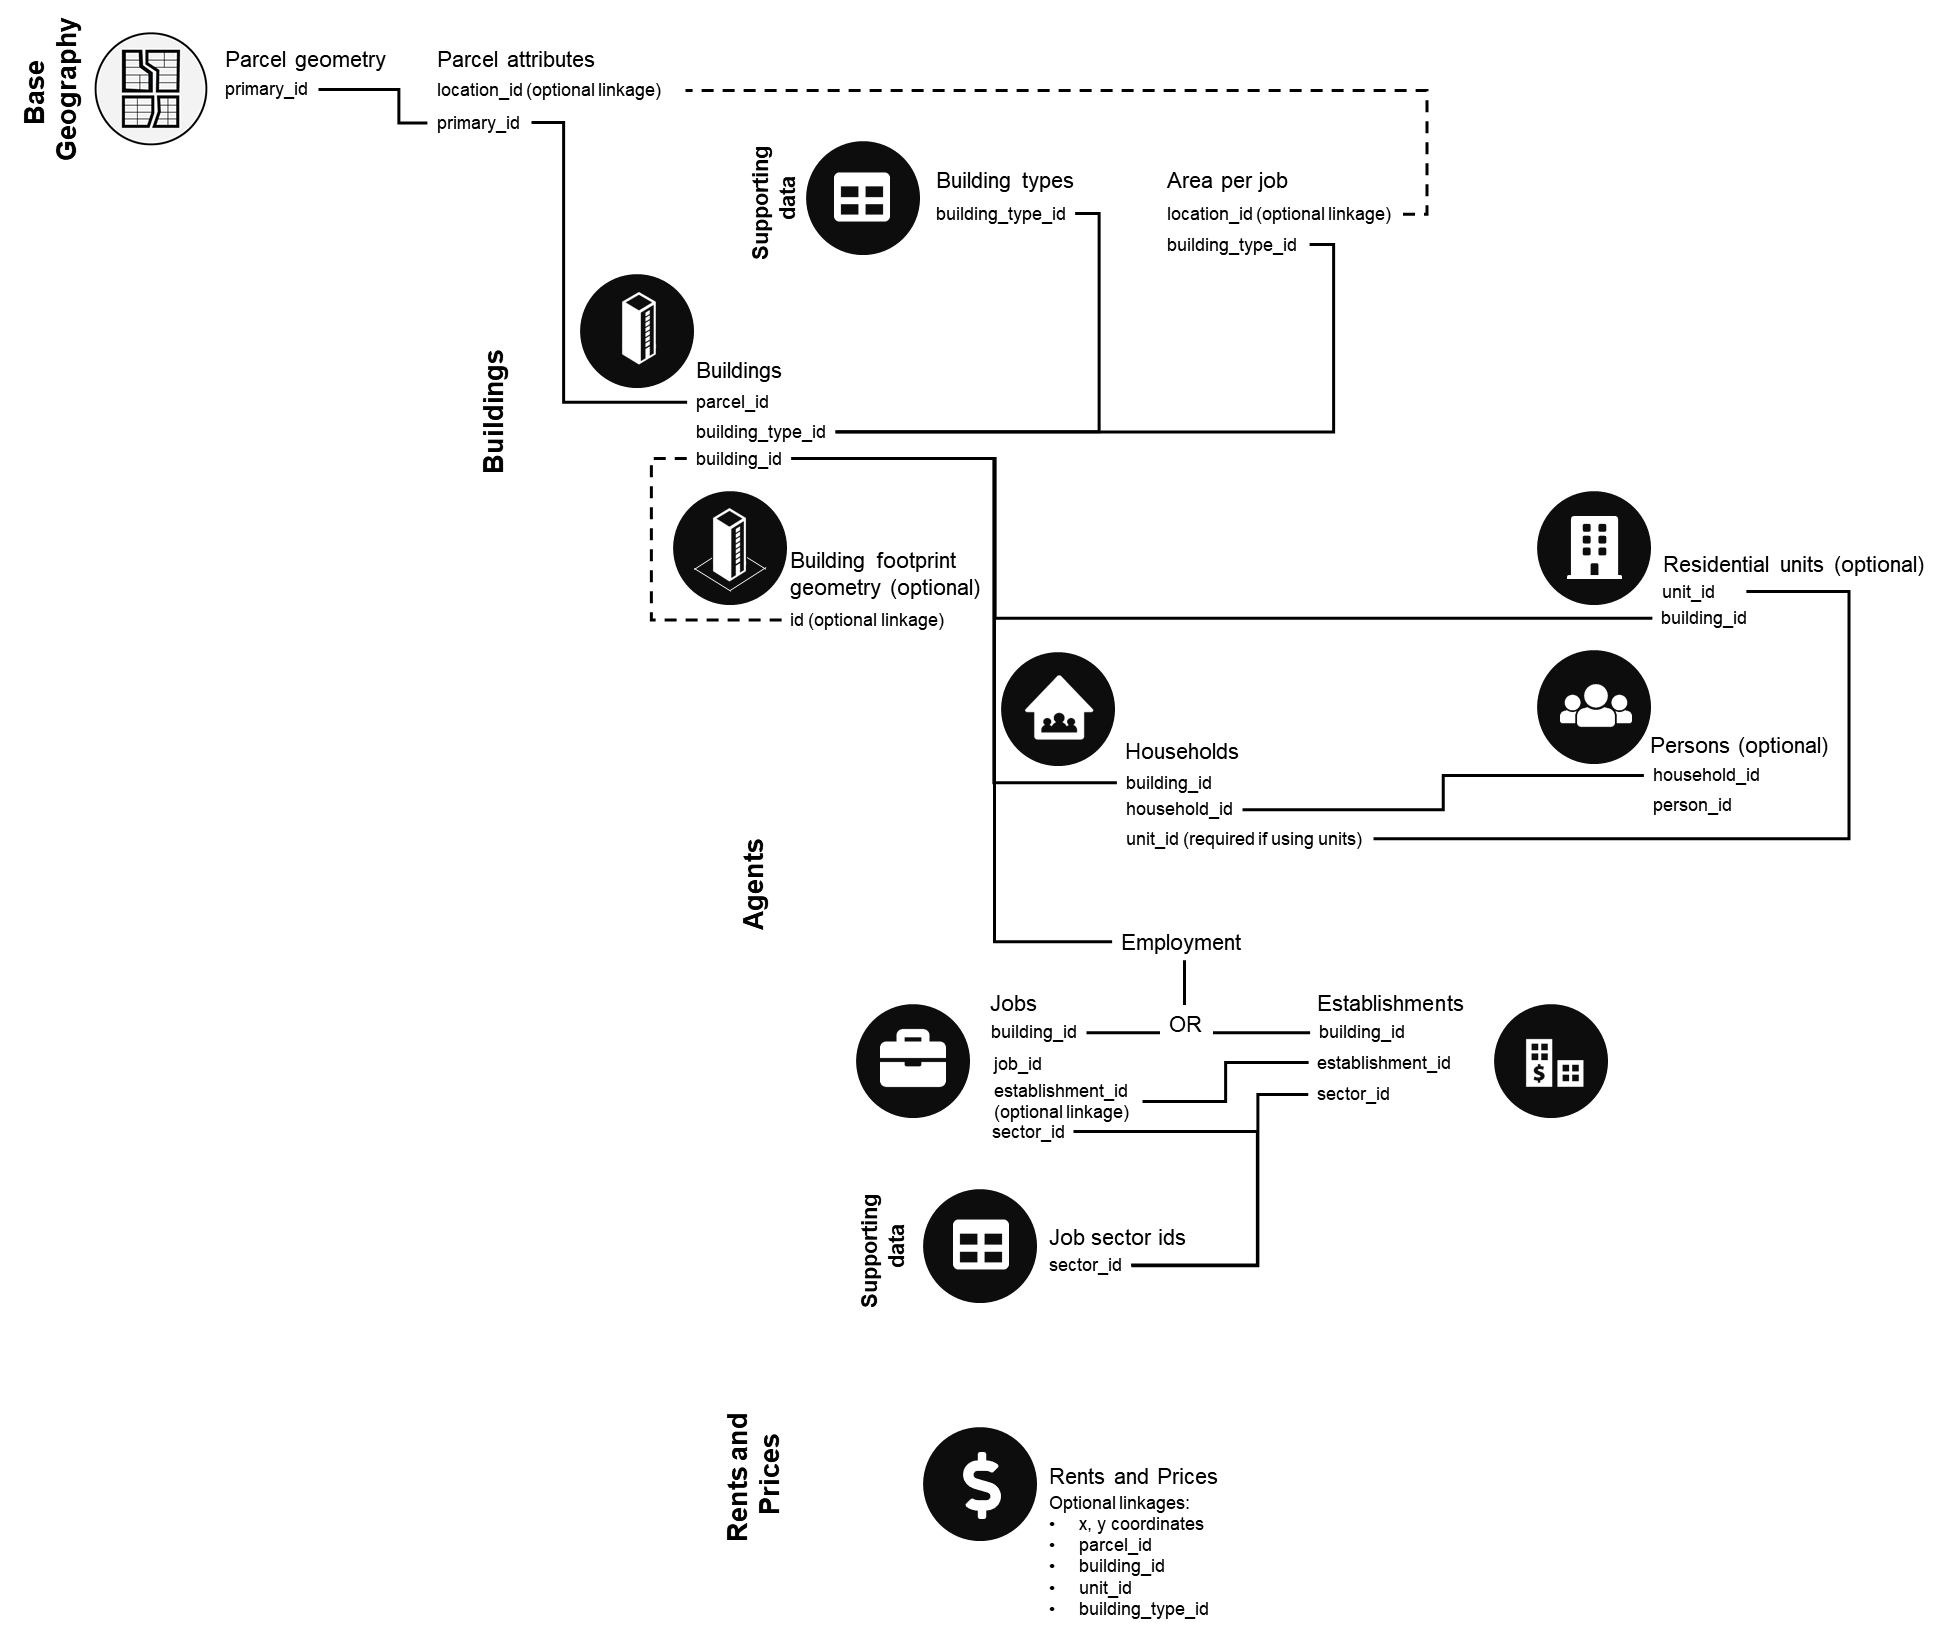
Parcel Model Connections Between Datasets
The connections between the various data tables required in the parcel-level model template are summarized in the figure below.
UrbanCanvas: Core Base Year Data
Both the parcel geometry and building types table are required to initialize the UrbanCanvas user interface for new subscribers.
Parcel geometry
UrbanCanvas Modeler requires a zipped (.zip) shapefile of regional parcel geometries with the same parcel identifier that is used in the simulation parcel attributes table and buildings table. This shapefile will be used as the base data geometry in the UrbanCanvas user interface and database. See Table 1 for the data schema. The parcel identifier is required to be a unique and sequentially generated integer number in a column named primary_id (legacy UrbanSim users have in the past referred to this column as the parcel_id column). The primary_id is used to link data created and uploaded into UrbanCanvas (e.g. development projects, constraints, etc.) with the core UrbanSim simulation data. This identifier will be displayed in the user interface for reference in the map and tables. As a convenience to users who wish to utilize a more commonly known identifier such as local assessor’s parcel identifiers you may optionally add a secondary ID column to the shapefile prior to upload. This secondary identifier will be displayed in the user interface for reference in the map when digitizing data inputs. Upon the creation of your UrbanCanvas user account, you must contact us here and supply your initial UrbanCanvas parcel geometries. After the geometries have passed UrbanSim’s quality and topology validation, UrbanSim will populate your UrbanCanvas account with the supplied geometries.
Discontinuous multi-part parcel geometries are discouraged as each parcel record is treated as a unit of land that can be developed all at once. Parcel geometry should support a clean accounting of land area when summarizing results at the parcel level or at coarser summary geographies. This means that parcel geometries should not be multi-part, overlapping, stacked, contain holes, or represent slivers. Parcels that represent land that is known to be undevelopable can and should be included as long as they have attributes that clearly discern their land use type and are marked as undevelopable. These parcels can provide useful information during model specification and for reference in the user interface. Parcels that represent infrastructure right of way, such as utilities, trails, and road and railways, are ok to represent in your parcels as long as these parcels are clearly marked as such. Parcels that represent common space in a condominium or townhome complex are also discouraged because the developer model may see this as developable land. In cases where parcels are large, such as airports, and can overlap multiple summary geography boundaries (e.g. TAZs), it may be worth considering slicing parcels along summary geography boundaries when parcels are inconsistent with summary geographies. Slicing parcels along key boundaries ensures that parcels will nest cleanly within coarser level geographies. For example, if zonal boundaries bisect a set of parcels, the accounting of land at the zone level (when aggregating attributes from parcel to zone) will be inaccurate. Clipping parcel boundaries can also be considered if substantial land area is underwater, such as a coastal parcels that can extend far out into a bay or ocean. The simulation is interested in the land area associated with parcels, not the water area, so unless the ocean is represented in an undevelopable layer, the underwater portion of parcels should be clipped away so as to avoid the model perceiving excess capacity. In summary, when parcels have geometry problems, this can lead to undesired simulation artifacts or negatively affect the behavior of imputation and visualization operations.
Note
Upon the initialization of your supplied parcel geometry in UrbanCanvas Modeler, if any changes or updates to the geometries are required after the initial upload you can change it at anytime if you do not have any existing development projects, constraints, or adjustments in your account. If these data exist in your account and you would like to change the parcel geometry and or the building types table set in the initialization collection please contact us here for assistance.
Column Name |
Data Type |
Required |
Description |
|---|---|---|---|
primary_id |
Integer |
Yes |
Unique parcel identifier, same as that used |
[ANY COLUMN NAME] |
String |
No |
Secondary parcel ID such as a local assessor’s parcel |
Building types
UrbanCanvas Modeler requires a table of regional building types that exist in the simulation buildings and area per job tables. This table is also used to initialize the building type categories available when creating new development projects and constraints from within the UrbanCanvas Modeler user interface. The building types table contains the typology of building types to use in the model. Each building record in the buildings table must be assigned one of the building_type_id’s found in the building types table. See Table 2 for details on the data schema. To denote a building type as a mixed use, set both is_residential and is_non_residential to True. Optionally, you may set a building type as neither residential nor non-residential and want to track development projects separately by setting is_other to True, such as hotel and resort units, you may do so however note that building types of other type are not used in the model. Upon the creation of your UrbanCanvas user account, you must contact us here and supply your initial UrbanCanvas building types table. After the building types table has passed UrbanSim’s quality assessment, UrbanSim will populate your UrbanCanvas account with the supplied building types table.
Note
Upon the initialization of your supplied building types table in UrbanCanvas Modeler, if any changes or updates to the table are required after the initial upload you can change it at anytime if you do not have any existing development projects, constraints, or adjustments in your account. If these data exist in your account and you would like to change the parcel geometry and or the building types table set in the initialization collection please contact us here for assistance.
Column Name |
Data Type |
Required |
Description |
|---|---|---|---|
building_type_id |
Integer |
Yes |
Unique identifier for the building type. Must |
name |
String |
Yes |
Name of the building type. Name will be displayed in the |
is_residential |
Boolean |
Yes |
True if building type can have a residential |
is_non_residential |
Boolean |
Yes |
True if building type can have a |
description |
String |
No |
Description of the building type |
is_other |
Boolean |
No |
True if building type is not a residential or a |
Simulation: Core Base Year Data
Parcels
Parcel attributes
Parcels are the unit of land on which construction takes place and the unit of land for which capacity for new built-space is calculated (as determined by zoning and other natural constraints). Each parcel may be associated with 0, 1, or more buildings. Each parcel record primary_id in this table must correspond to the same primary_id in the parcel geometry data. An unlimited number of optional columns may be added to this table for use, however the model will interpret the columns listed as optional below by default. See Table 3 for the data schema. If you are stratifying your area per job table by sub-area, you may tag parcel records using a location_id which must correspond with the sub-area location_id denoted in the area per job table. Optionally, you may include a area column that denotes the buildable land area of the parcel, otherwise the area of the parcel will be automatically generated from the provided parcel geometries.
Column Name |
Data Type |
Required |
Description |
|---|---|---|---|
primary_id |
Integer |
Yes |
Unique parcel identifier. Must correspond to the |
land_use_type_id |
Integer |
No |
ID of parcel land use type |
land_value |
Integer |
No |
Assessed value of the parcel’s land |
tax_exempt_status |
Integer |
No |
1 if parcel is exempt from taxes, else 0 |
apn |
Integer |
No |
Assessor’s local parcel identifier, if applicable |
location_id |
Integer |
No |
All summary geographies for which you would like to summarize |
area |
Float |
No |
Land area of parcel in acres or hectares |
Buildings
Buildings
The base-year buildings table is typically derived from parcel data. If the data supports it, there can be multiple buildings on a parcel (a many to one relationship between buildings and parcels). Each building links to a specific parcel_id. The buildings table is modified by the pro forma-based real estate development model (which introduces new buildings and in some cases demolishes old ones) and price models (which update the price fields). The scheduled development events model will also add records to this table. The buildings table represents the built space that agents in the simulation will occupy. Each household and job will be assigned to a specific building. It is ok to leave price fields as null at first if price information is not available for every building; model prices based on a separate sample of buildings and the price columns on the main building table can then be filled in by hedonic model predictions at the beginning of the simulation. See Table 4 for the fields in the buildings table. An unlimited number of optional columns may be added to this table for use, however the model will interpret the columns listed as optional below by default.
If price fields are left un-populated on the buildings table, then separate data sources for residential and non-residential rent and prices will need to be supplied for the purpose of estimating the real estate price models. Contact us here for common sources of proprietary rental and prices data. If other building attributes are missing or low-quality, imputation work may need to be undertaken. For example, if assessor-based building data has poor information on government buildings, we may supplement the assessor-derived buildings with other government data on publicly-owned buildings. For example, in the Unites States if a particular county assessor does not collect data on the number of building stories, we may populate the stories attribute for existing building records in that county based on elevator permit data, which has information on number of floors. Alternatively stories can be derived using building heights, if available. If residential year built information is missing, estimates from the US Census American Community Survey (ACS) can be utilized to help fill in gaps. Missing and outlying attribute values are replaced with predicted or separately-observed values. In the building imputation process, multiple datasets may be brought in, each with different strengths, to arrive at a better final dataset.
Column Name |
Data Type |
Required |
Description |
|---|---|---|---|
building_id |
Integer |
Yes |
Unique building identifier. |
parcel_id |
Integer |
Yes |
Parcel ID of the building that corresponds to the |
building_type_id |
Integer |
Yes |
ID of the building’s structure type that |
residential_units |
Integer |
Yes |
Total residential units in building |
residential_sqft |
Integer |
Yes |
Amount of residential square footage |
non_residential_sqft |
Integer |
Yes |
Amount of non-residential square footage |
stories |
Integer |
Yes |
Number of stories in building |
year_built |
Integer |
Yes |
Year of construction |
improvement_value |
Float |
No |
Assessed value of the building. Values should be |
occupancy_restriction |
Integer |
No |
Values that correspond to a corresponding |
res_price_per_sqft_[YEAR] |
Float |
No |
Predicted or observed residential price |
non_res_price_per_sqft_[YEAR] |
Float |
No |
Predicted or observed non-residential |
res_rent_per_sqft_[YEAR] |
Float |
No |
Predicted or observed residential rent per |
non_res_rent_per_sqft_[YEAR] |
Float |
No |
Predicted or observed non-residential rent |
Column Name |
Data Type |
Required |
Description |
|---|---|---|---|
building_id |
Integer |
Yes |
Unique building identifier. |
parcel_id |
Integer |
Yes |
Parcel ID of the building that corresponds to the |
building_type_id |
Integer |
Yes |
ID of the building’s structure type that |
residential_units |
Integer |
Yes |
Total residential units in building |
residential_sqm |
Integer |
Yes |
Amount of residential square meters |
non_residential_sqm |
Integer |
Yes |
Amount of non-residential square meters |
stories |
Integer |
Yes |
Number of stories in building. See note on the use of |
year_built |
Integer |
Yes |
Year of construction |
improvement_value |
Float |
No |
Assessed value of the building. Values should be |
occupancy_restriction |
Integer |
No |
Values that correspond to a corresponding |
res_price_per_sqm_[YEAR] |
Float |
No |
Predicted or observed residential price |
non_res_price_per_sqm_[YEAR] |
Float |
No |
Predicted or observed non-residential |
res_rent_per_sqm_[YEAR] |
Float |
No |
Predicted or observed residential rent per |
non_res_rent_per_sqm_[YEAR] |
Float |
No |
Predicted or observed non-residential rent |
Note
The stories column can also be named storeys. Both spellings are accepted.
Residential units (Optional)
The residential units table contains disaggregate residential unit data for mixed-use and or residential buildings the region, with each row pertaining to one residential unit. Each unit must be tied to a specific building in the buildings table using building_ids. The residential units table is not required for the parcel model and is optional. This table can typically be generated using the attributes in the buildings table and optional unit attributes can be added using other sources of observed or predicted data. An unlimited number of optional columns may be added to this table for use, however the model will interpret the columns listed as optional below by default.
During simulation, new units will be introduced into or removed from this table based on building-level predictions of the proforma-based developer model. Optionally, you may also specify unit_ids in the households table to tie households to residential units. See Table 5 for the residential units table data schema.
If rent and or price fields are left un-populated on the residential units table, then separate data sources for residential rent and prices will need to be supplied for the purpose of estimating the real estate price models. Contact us here for common sources of proprietary rental and price data and consult the rent and price data uploaders available in the user interface.
Column Name |
Data Type |
Required |
Description |
|---|---|---|---|
unit_id |
Integer |
Yes |
Unique residential unit record identifier |
building_id |
Integer |
Yes |
Building ID of the building the unit is |
tenure |
Integer |
No |
Typically tenure is coded as (1 : own, 2 : rent), however |
residential_sqft |
Integer |
No |
Amount of residential square footage. |
residential_sqm |
Integer |
No |
Amount of residential square meters. |
bathrooms |
Float |
No |
Number of bathrooms |
bedrooms |
Float |
No |
Number of bedrooms |
rent |
Float |
No |
Predicted or observed rent per month for unit |
price |
Float |
No |
Predicted or observed price for unit |
occupancy_restriction |
Integer |
No |
Values that correspond to a corresponding |
max_income |
Integer |
No |
Maximum annual household income |
min_age |
Integer |
No |
Minimum age of all persons in household |
rent_control |
Boolean |
No |
1 if any type of rent control applies to unit, |
Note
Only one, either a residential_sqft or a residential_sqm column can be supplied, both columns are not required.
Area per job
The area per job table contains the non-residential square footage or meters each job will occupy in each building type, or optionally in each combination of building type and zone as denoted with the use of a location_id that corresponds to the location_id in the parcel table. This information is used in the calculation of both the number of job spaces in each building and non-residential vacancy rates. This table must have a building_type_id that corresponds to the IDs in the building types table.
Column Name |
Data Type |
Required |
Description |
|---|---|---|---|
building_type_id |
Integer |
Yes |
ID of mixed-use or non-residential building |
area_per_job |
Float |
Yes |
The unit of space required per job in square feet or meters. |
location_id |
Integer |
No |
ID of geography that corresponds to a location ID |
Building footprints (Optional)
If building footprint geometries are available for the region or any part of the region, you may provide these data as a zipped (.zip) shapefile for use in UrbanCanvas for data visualization purposes. These data are optional to provide and the region does not need to have full coverage. The only required column is the unique building id. This ID does not need to correspond to the building_ids in the buildings table, however it is recommended that they do.
Column Name |
Data Type |
Required |
Description |
|---|---|---|---|
id |
Integer |
Yes |
Unique building identifier. Does not need |
height |
Integer |
No |
Maximum height of building in feet or meters. For use in |
Agents
Households
Households
The household table contains disaggregate household data for the region, with each row pertaining to one synthesized household. This can be generated by a population synthesizer such as Synthpop [10]. During simulation, new households will be introduced into this table to match household control totals provided by the user. The building_id of households in simulation will be populated by UrbanSim’s Household Location Choice Model. If the region has conducted a travel survey and if this survey contains information on recent-mover status of households, this can be used in model estimation to supplement the full households table. In the absence of observed recent-movers from a travel survey, it is recommended that the population be synthesized with recent-mover status (For US data: “when moved into current dwelling”) as a control variable. Optionally, a persons table can be used as well. See Table 8 for the household table data schema. An unlimited number of optional columns may be added to this table for use, however the model will interpret the columns listed as optional below by default. Any of the household characteristics in the table below can be utilized in model adjustments and household control totals.
Column Name |
Data Type |
Required |
Description |
|---|---|---|---|
household_id |
Integer |
Yes |
Unique household record identifier |
building_id |
Integer |
Yes |
Building ID of the building the household is |
persons |
Integer |
Yes |
Number of persons in the household (For US |
income |
Integer |
Yes |
Annual household income in 2013 dollars (For |
tenure |
Integer |
Yes |
Typically tenure is coded as (1 : own, 2 : rent), however |
unit_id |
Integer |
No |
Unit ID of the residential unit the household is |
serialno |
Integer or String |
No |
For US data only, Public Use Microdata Sample (PUMS) serial |
cars |
Integer |
No |
Number of vehicles in the household (For US |
race_of_head |
Integer |
No |
Race code of head of household (For |
age_of_head |
Integer |
No |
Age of head of household (For US data, see [3]) |
workers |
Integer |
No |
Number of workers (employed persons) in the |
children |
Integer |
No |
Number of persons under age 18 in household |
recent_mover |
Boolean |
No |
1 if household moved within last 5 |
Persons (Optional)
The persons table is an optional table that contains disaggregate persons data for the region, with each row pertaining to one synthesized person. The persons table should have a household_id attribute corresponding to the household table that indicates which household each person is in. The UrbanSim transition model has the ability to keep the households and persons table in sync as it seeks to match values in the annual household control totals table. See Table 9 for the persons table data schema. An unlimited number of optional columns may be added to this table for use, however the model will interpret the columns listed as optional below by default.
Column Name |
Data Type |
Required |
Description |
|---|---|---|---|
person_id |
Integer |
Yes |
Unique person record identifier |
household_id |
Integer |
Yes |
Unique household record identifier. Must |
member_id |
Integer |
No |
For US data, PUMS person number, see PUMS SPORDER variable) |
age |
Integer |
No |
Age of person in years (For US data, see PUMS AGEP variable) |
income |
Integer |
No |
Person annual income in 2013 dollars (For US data, |
education |
Integer |
No |
Person educational attainment (For US data, |
race_id |
Integer |
No |
Race code of person (For US data, |
hh_relationship |
Integer |
No |
Person relationship to household (For |
sex |
Integer |
No |
Person gender (1 : male, 2 : female) (For US data, |
student_status |
Boolean |
No |
Person student status (For US data, see |
worker_status |
Boolean |
No |
Person worker status (For US data, see |
hours |
Integer |
No |
Person hours worked per week in past 12 months (For |
work_at_home |
Boolean |
No |
Person worker status, where 1 if person works |
Employment
Employment can be represented in one of two ways, as 1) disaggregated jobs or 2) as establishments. One or the other can be used to represent employment in the region but both are not required. Establishment data can be more difficult to collect and clean, but it facilitates a more behavioral way to represent employment and allows for the use of future firmographic models.
Jobs
The jobs table contains one record for each job in the region. A job is tied to the buildings table using the building_id. Multiple job records can exist in the same building. The sector_id references the employment sector a job pertains to and is tied to the sector IDs in the job sector IDs table sector_id column. The sector_id and any other optional columns can be utilized in model adjustments and employment control totals. During simulation, new jobs will be introduced into this table to match employment control totals provided by the user. The building_id of jobs in simulation will be populated by UrbanSim’s Employment Location Choice Model. The home_based field is optional, and indicates whether the job is based in a residential unit. Note that, just as with the households table, it is possible to have a separate supplementary jobs table for model estimation if a specific sample of jobs should be used for estimating the employment location choice model (e.g. if observed data is available on recently locating firms/jobs). See Table 10 for a description of the jobs table columns. An unlimited number of optional columns may be added to this table for use, however the model will interpret the columns listed as optional below by default.
Column Name |
Data Type |
Required |
Description |
|---|---|---|---|
job_id |
Integer |
Yes |
Unique job record identifier |
sector_id |
Integer |
Yes |
Employment sector ID. Must correspond to the sector_ids |
building_id |
Integer |
Yes |
Building ID of the building the job is |
home_based |
Boolean |
No |
Where 1 denotes the job must locate in a |
occupation |
Integer |
No |
Identifier of occupation category |
recent_mover |
Boolean |
No |
1 if job moved within last 5 years, else 0 |
establishment_id |
Integer |
No |
If jobs were generated from establishments |
Establishments
The establishment table contains one record for each business establishment or firm in the region. The employees attribute indicates how many jobs are in each establishment. An establishment is tied to the buildings table using the building_id. Multiple establishment records can exist in the same building. The sector_id references the employment sector an establishment pertains to. During simulation, new establishments will be introduced into this table to match employment control totals provided by the user. The building_id of establishments in simulation will be populated by UrbanSim’s Employment Location Choice Model. See Table 11 for a description of the establishment table columns. An unlimited number of optional columns may be added to this table for use, however the model will interpret the columns listed as optional below by default.
Column Name |
Data Type |
Required |
Description |
|---|---|---|---|
establishment_id |
Integer |
Yes |
Unique establishment record identifier. |
employees |
Integer |
Yes |
Total number of employees in establishment |
sector_id |
Integer |
Yes |
Employment sector ID. Must correspond to the sector_ids |
building_id |
Integer |
Yes |
Building ID of the building the establishment is |
home_based |
Boolean |
No |
Where 1 denotes the establishment must locate in a |
recent_mover |
Boolean |
No |
1 if establishment moved within last 5 years, else 0 |
Job Sector IDs
The job sector ID table denotes all the unique employment sector IDs that are utilized in either the jobs or establishment tables. This table must have the sector_id and corresponding sector name as columns. This table will be used in UrbanCanvas as a reference in the user interface and to generate indicators. An unlimited number of optional columns may be added to this table for use, however the model will interpret the columns listed as optional below by default.
Column Name |
Data Type |
Required |
Description |
|---|---|---|---|
sector_id |
Integer |
Yes |
Unique employment sector ID. Represents the corresponding |
name |
String |
Yes |
Name of employment sector. This name will be used as a |
Rents and Prices
The market price of built space is a key input to UrbanSim and is also a modeled output of UrbanSim. Prices play a role in the demand-side models as an explanatory variable in household and employment location choices. They also play a role in the supply-side model, as an ingredient of calculating profitabilities in the proforma-based real estate developer model. Models of real estate rents and prices are estimated so that rents and prices are updated endogenously in the model system. If the model system has a price equilibration component, prices in the model are further updated based on a demand-price equilibration routine.
Rent and price data can be appended as columns to the buildings and/or residential units table, or supplied as separate uploaded datasets. Price observations need not be comprehensive for all built space, a sample of prices can be used to estimate a model that can then be applied to predict prices more broadly. It is suggested you upload separate rent and price data using the rent and price data uploader following the data schema for each building and transaction types listed in the following sections below. Once uploaded, you may manage each dataset separately from the rest of your base data. You can choose to use specific data in UrbanSim or simply choose to upload and explore these data on the map.
Residential Rents
Observed data on the rental price of residential space provides a price signal for the renter side of the residential real estate market. Based on the supplied data, regression models of residential rents are estimated and the predicted values are then input to both the proforma and renter segments of the household location choice model. It is not required to connect these data directly to parcels however you may use the optional identification columns below to tie data directly to your other base data tables or use x (longitude) and y (latitude) columns to tie directly to parcel locations. Coordinates must be in the World Geodetic System 1984 (WGS84) coordinate system. When coordinates are present in the data, the data will automatically be available to view on the map as a point layer.
Column Name |
Data Type |
Required |
Description |
|---|---|---|---|
year |
Integer |
Yes |
Year of the transaction |
rent |
Float |
Yes |
Predicted or observed rent per unit per month |
x |
Float |
No |
Longitude coordinate of transaction address or centroid. |
y |
Float |
No |
Latitude coordinate of transaction address or centroid. |
unit_id |
Integer |
No |
Unit ID of the transaction. Corresponds to the residential unit table unit_id column. |
building_type_id |
Integer |
No |
ID of mixed-use or residential building |
building_id |
Integer |
No |
Building ID of the transaction. Corresponds to |
parcel_id |
Integer |
No |
Parcel ID of the transaction. Corresponds to the |
residential_sqft |
Integer |
No |
Amount of residential square footage |
residential_sqm |
Integer |
No |
Amount of residential square meters |
year_built |
Integer |
No |
Year of building construction |
bathrooms |
Float |
No |
Number of bathrooms |
bedrooms |
Float |
No |
Number of bedrooms |
Note
Only one, either a residential_sqft or a residential_sqm column can be supplied, both columns are not required.
Residential Prices
Observed data on the sale price of residential space provides a price signal for the ownership side of the residential real estate market. Based on the supplied data, regression models of residential sale prices are estimated and the predicted values are then input to both the proforma and owner segments of the household location choice model. It is not required to connect these data directly to parcels however you may use the optional identification columns below to tie data directly to your other base data tables or use x (longitude) and y (latitude) columns to tie directly to parcel locations. Coordinates must be in the World Geodetic System 1984 (WGS84) coordinate system. When coordinates are present in the data, the data will automatically be available to view on the map as a point layer.
Column Name |
Data Type |
Required |
Description |
|---|---|---|---|
year |
Integer |
Yes |
Year of the transaction |
price |
Float |
Yes |
Predicted or observed price per unit |
x |
Float |
No |
Longitude coordinate of transaction address or centroid. |
y |
Float |
No |
Latitude coordinate of transaction address or centroid. |
unit_id |
Integer |
No |
Unit ID of the transaction. Corresponds to the residential unit table unit_id column. |
building_type_id |
Integer |
No |
ID of mixed-use or residential building |
building_id |
Integer |
No |
Building ID of the transaction. Corresponds to |
parcel_id |
Integer |
No |
Parcel ID of the transaction. Corresponds to the |
residential_sqft |
Integer |
No |
Amount of residential square footage |
residential_sqm |
Integer |
No |
Amount of residential square meters |
year_built |
Integer |
No |
Year of building construction |
bathrooms |
Float |
No |
Number of bathrooms |
bedrooms |
Float |
No |
Number of bedrooms |
Note
Only one, either a residential_sqft or a residential_sqm column can be supplied, both columns are not required.
Non-Residential Rents
Observed data on the rental price of non-residential space provides a price signal for the non-residential real estate market. Based on the supplied data, regression models of non-residential rents are estimated and the predicted values are then input to both the proforma and employment location choice model. It is not required to connect these data directly to parcels however you may use the optional identification columns below to tie data directly to your other base data tables or use x (longitude) and y (latitude) columns to tie directly to parcel locations. Coordinates must be in the World Geodetic System 1984 (WGS84) coordinate system. When coordinates are present in the data, the data will automatically be available to view on the map as a point layer.
Column Name |
Data Type |
Required |
Description |
|---|---|---|---|
year |
Integer |
Yes |
Year of the transaction |
rent |
Float |
Yes |
Predicted or observed rent per square foot per year |
x |
Float |
No |
Longitude coordinate of transaction address or centroid. |
y |
Float |
No |
Latitude coordinate of transaction address or centroid. |
building_type_id |
Integer |
No |
ID of mixed-use or non-residential building |
building_id |
Integer |
No |
Building ID of the transaction. Corresponds to |
parcel_id |
Integer |
No |
Parcel ID of the transaction. Corresponds to the |
non_residential_sqft |
Integer |
No |
Amount of non-residential square footage |
residential_sqm |
Integer |
No |
Amount of residential square meters |
year_built |
Integer |
No |
Year of building construction |
Note
Only one, either a residential_sqft or a residential_sqm column can be supplied, both columns are not required.
Non-Residential Prices
Observed data on the sale price of non-residential space provides a price signal for the non-residential real estate market. Based on the supplied data, regression models of non-residential sale prices are estimated and the predicted values are then input to both the proforma and employment location choice model. It is not required to connect these data directly to parcels however you may use the optional identification columns below to tie data directly to your other base data tables or use x (longitude) and y (latitude) columns to tie directly to parcel locations. Coordinates must be in the World Geodetic System 1984 (WGS84) coordinate system. When coordinates are present in the data, the data will automatically be available to view on the map as a point layer.
Column Name |
Data Type |
Required |
Description |
|---|---|---|---|
year |
Integer |
Yes |
Year of the transaction |
price |
Float |
Yes |
Predicted or observed price per square foot |
x |
Float |
No |
Longitude coordinate of transaction address or centroid. |
y |
Float |
No |
Latitude coordinate of transaction address or centroid. |
building_type_id |
Integer |
No |
ID of mixed-use or non-residential building |
building_id |
Integer |
No |
Building ID of the transaction. Corresponds to |
parcel_id |
Integer |
No |
Parcel ID of the transaction. Corresponds to the |
non_residential_sqft |
Integer |
No |
Amount of non-residential square footage |
residential_sqm |
Integer |
No |
Amount of residential square meters |
year_built |
Integer |
No |
Year of building construction |
Note
Only one, either a residential_sqft or a residential_sqm column can be supplied, both columns are not required.
Model Calibration Data
The calibration method applied to the parcel model will differ for each region and subscriber. The calibration method most appropriate will be determined as part of the parcel model subscriber consulting contract. Typically, we calibrate to a longitudinal dataset that is separate from the validation set. Calibration data also tends to be spatially coarser than validation data so as not to have the calibration process excessively constrain the sensitivities of the model. The goals of the calibration process are to move relative spatial variation of simulated growth towards observed patterns, and to proxy for unobserved factors not accounted for by the explanatory variables in the location choice models.
User Uploaded Scenario Inputs
There are a number of parcel model scenario inputs that can be uploaded into the platform using the uploader tool. You can then select each data type to use in a scenario.
Annual Household Control Totals
A key input to UrbanSim is an assumption about total regional household growth in the forecast period. When composing a scenario, this input can be expressed as a growth rate, or alternatively, as an uploaded control totals table. A household control totals table (annual household control totals) gives the total number of households in the region by year, for every year between the model base-year (e.g. 2010) and the forecast year (e.g. 2050). This information is typically based on a macro-economic forecast or data from the state demographer. The regional household totals can optionally be broken down by demographic group, giving control over how aggregate household characteristics are transitioned over time in the simulation. You may use any of the household characteristics in the households table to segment your control total table.
Both regional and sub-regional control totals are supported in the control total uploader. If control totals are sub-regional, include a sub-regional location identifier column that corresponds to a location identifier in the parcel attribute table (e.g. county_id).
Note
To utilize sub-regional control totals in your model please contact us here.
Column Name |
Data Type |
Required |
Description |
|---|---|---|---|
year |
Integer |
Yes |
Year |
total_number_of_households |
Integer |
Yes |
Total number of households in year |
total_number_of_people |
Integer |
No |
Optional field, total number of people in household |
[SUB-REGIONAL_LOCATION_ID] |
Integer |
No |
Optional field, required field if applying sub-regional control |
The minimum requirement for a household control totals table is that it contains two columns: year and total_number_of_households. For example:
year |
total_number_of_households |
|---|---|
2010 |
1000 |
2011 |
1100 |
2012 |
1200 |
2013 |
1300 |
2014 |
1400 |
For additional control over how aggregate household characteristics transition over time, annual household totals can be segmented by adding additional columns and rows. For example, by adding persons_min and persons_max columns to the table, we segment the total number of households by household size:
year |
total_number_of_households |
persons_min |
persons_max |
|---|---|---|---|
2010 |
300 |
1 |
1 |
2010 |
200 |
2 |
2 |
2010 |
100 |
3 |
3 |
2010 |
250 |
4 |
-1 |
2011 |
330 |
1 |
1 |
2011 |
220 |
2 |
2 |
2011 |
110 |
3 |
3 |
2011 |
270 |
4 |
-1 |
The first row indicates that there are 300 households of size one in year 2010. UrbanSim recognizes that persons is an attribute of the households table, and the _min and _max column naming convention communicates to the model that the control total in the first row applies to households with a minimum of one person and a maximum of one person. Similarly, row 2 indicates that there are 200 households of size two in year 2010, and row 5 indicates that in 2011 there are 330 households of size one. In columns with name containing _min or _max, a value of -1 means no limit. So row 4 of the table pertains to households with four or more persons (no upper bound).
Another example of a segmented control totals table, this time where the segmentation of household totals is by income:
year |
total_number_of_households |
income_min |
income_max |
|---|---|---|---|
2010 |
500 |
0 |
30000 |
2010 |
900 |
30000 |
-1 |
2011 |
480 |
0 |
30000 |
2011 |
950 |
30000 |
-1 |
This example table buckets households into two income-based categories: those with <=30,000 in income, and those with >30,000 in income. The low-income bucket shrinks from 500 households in 2010 to 480 households in 2011. The high-income bucket grows from 900 households in 2010 to 950 households in 2011. This example region has 1400 (500 + 900) total households in year 2010, and 1430 (480 + 950) total households in year 2011.
Additional columns added to the household control totals table do not have to be expressed in _min and _max terms if the added column pertains to a known household attribute and no minimum/maximum attribute values are needed in the group definitions. For example:
year |
total_number_of_households |
tenure |
|---|---|---|
2010 |
700 |
1 |
2010 |
800 |
2 |
2011 |
730 |
1 |
2011 |
820 |
2 |
This table indicates that in year 2010 there are 700 households with tenure = 1 (own), and 800 households of tenure = 2 (rent).
As the examples above show, annual household control totals tables give you the ability to break down regional household totals by detailed demographic characteristics. This table is the mechanism by which one can simulate demographic trends such as decreasing average household size, increasing average income, and increasing average age of household head.
To utilize a control totals table in UrbanCanvas, create a .csv file representing the table, and then use the Upload feature to upload and name the table. In Uploads, look for the Household Control Totals uploader. The uploaded control totals table can then be referenced when composing a scenario. Scenarios can reflect alternative demographic assumptions if they point to different control totals table. For example, one scenario can reference a baseline household control totals table, and a different scenario can reference a household control totals table that shows a decline in home-ownership. Remember that household control totals tables need to contain information for every year between the base year and the forecast year.
Annual Employment Control Totals
A key input to UrbanSim is an assumption about total regional employment growth in the forecast period. When composing a scenario, this input can be expressed as a single growth rate, or alternatively, as an uploaded control totals table. An employment control totals table (annual employment control totals) gives the total number of jobs in the region by year, for every year between the model base-year (2010) and the forecast year (e.g. 2050). This information is typically based on a macro-economic forecast or data from the state demographer. The regional employment totals can optionally be broken down by sector, giving control over how the sectoral make-up of the economy changes over time in the simulation. You may use the sector_ids as well as any other characteristic available in the jobs table or establishments table) to segment your control total table.
Both regional and sub-regional control totals are supported in the control total uploader. If control totals are sub-regional, include a sub-regional location identifier column that corresponds to a location identifier in the parcel attribute table (e.g. county_id).
Note
To utilize sub-regional control totals in your model please contact us here.
Column Name |
Data Type |
Required |
Description |
|---|---|---|---|
year |
Integer |
Yes |
Year |
total_number_of_jobs |
Integer |
Yes |
Total number of jobs in year |
sector_id |
Integer |
No |
Optional field, required if segmenting by this attribute, |
home_based |
Boolean |
No |
Optional field, required if segmenting by this attribute, |
occupation |
Integer |
No |
Optional field, required if segmenting by this attribute, |
recent_mover |
Boolean |
No |
Optional field, required if segmenting by this attribute, |
[SUB-REGIONAL_LOCATION_ID] |
Integer |
No |
Optional field, required field if applying sub-regional control |
The minimum requirement for an employment control totals table is that it contains two columns: year and total_number_of_jobs. For example:
year |
total_number_of_jobs |
|---|---|
2010 |
800 |
2011 |
900 |
2012 |
1000 |
2013 |
1100 |
2014 |
1200 |
For additional control of the employment sector break-down over time, annual employment totals can be segmented by adding an additional column named sector_id:
year |
total_number_of_jobs |
sector_id |
|---|---|---|
2010 |
100 |
11 |
2010 |
100 |
21 |
2010 |
100 |
22 |
2010 |
100 |
23 |
2010 |
100 |
3133 |
2010 |
100 |
42 |
2010 |
100 |
4445 |
2010 |
100 |
4849 |
2010 |
100 |
51 |
2010 |
100 |
52 |
2010 |
100 |
53 |
2010 |
100 |
54 |
2010 |
100 |
55 |
2010 |
100 |
56 |
2010 |
100 |
61 |
2010 |
100 |
62 |
2010 |
100 |
71 |
2010 |
100 |
72 |
2010 |
100 |
81 |
2010 |
100 |
92 |
2011 |
200 |
11 |
2011 |
200 |
21 |
2011 |
200 |
22 |
2011 |
200 |
23 |
2011 |
200 |
3133 |
2011 |
200 |
42 |
2011 |
200 |
4445 |
2011 |
200 |
4849 |
2011 |
200 |
51 |
2011 |
200 |
52 |
2011 |
200 |
53 |
2011 |
200 |
54 |
2011 |
200 |
55 |
2011 |
200 |
56 |
2011 |
200 |
61 |
2011 |
200 |
62 |
2011 |
200 |
71 |
2011 |
200 |
72 |
2011 |
200 |
81 |
2011 |
200 |
92 |
The sector ID’s must match those that were used in your jobs table or establishments table). Each employment sector in this mock example has 100 regional jobs in year 2010 and 200 regional jobs in year 2011. The annual employment control totals table is the mechanism by which sectoral growth and decline is simulated. For example, one might create a scenario-specific control totals table to simulate the impact of a rapid increase in healthcare jobs over the forecast horizon.
To utilize an employment control totals table in UrbanCanvas, create a .csv file representing the table, and then use the upload feature to upload and name the table. In Uploads, look for the Employment Control Totals uploader. The uploaded control totals table can then be referenced when composing a scenario. Scenarios can reflect alternative employment assumptions if they point to different control totals table. For example, one scenario can reference a baseline employment control totals table, and a different scenario can reference an employment control totals table that shows certain sectors growing faster or declining faster. Remember that control totals tables need to contain information for every year between the base year and the forecast year.
Travel Model Zones
Travel model zones (i.e. traffic analysis zones, TAZs) is the unit of geography used by most regional travel models. UrbanSim is typically run in order to feed land use inputs to a regional travel model, so UrbanSim output needs to be summarized at the travel model zone-level. This can be achieved by downloading the parcel-level simulation results and manually aggregating upwards to zone. As a convenience, UrbanCanvas offers a travel model zone uploader so that users can upload their zonal geography, and then UrbanSim will automatically return results at the zone level (i.e. do the parcel-to-zone aggregation). The file format should be a zipped (.zip) shapefile. The only requirement for the shapefile is that it should have an integer field named zone_id with the travel model zone ID values. The TAZ uploader displays the percent of the base data geometry polygons that have been successfully intersected with the TAZ polygons. Once uploaded, travel model zones can be assigned to specific scenarios where post-simulation the resulting indicators will be available as indicators viewable on the map or downloadable as a CSV at the specified zone geography. The zone_ids for the zones selected for the scenario must correspond to the zone_ids in the corresponding skims that have been selected for the scenario.
Note
Parcels are automatically assigned a TAZ ID when a TAZ file is uploaded using a parcel polygon largest area overlap by TAZ polygon intersection operation. This operation is re-run whenever the base data geometry in the initialization collection changes in order to keep the lookup tables up to date.
Column Name |
Data Type |
Description |
|---|---|---|
zone_id |
Integer |
Travel model zone ID |
Travel Model Skims
Travel model skims contain zone to zone travel times (sometimes along with other measures of impedance), as generated by a regional travel model. It is desirable to have skims represented in UrbanSim for the calculation of zonal accessibility metrics, and to facilitate feedback between the travel model and UrbanSim. Skims can be uploaded at any time, but a pre-requisite for using the skims in the model is to already have travel model zones uploaded. Skims should be formatted as a CSV file with, at the minimum, the following fields: from_zone_id, to_zone_id. Each row represents one zone-to-zone pair. Any number of impedance columns with any arbitrary column name are accepted. An example of an impedance measure is: AM peak period travel time from origin zone to destination zone, in minutes.
When used in scenarios, the zone_ids for the skims selected for the scenario must correspond to the zone_ids in the corresponding travel model zones that have been selected for the scenario. A single skim CSV file should represent travel times for a single year (e.g 2010) or travel times for a single range of years (e.g. 2010-2015). The year or year range that each skim represents is specified when skims are selected for use in a scenario. Skim CSV files do not need to include a year column because of the aforementioned method of specifying the skim year in the scenario form. If the CSV does contain a year column, only one single year value can be included. If travel times are different between multiple years, specific skim travel time CSV files for those years should be uploaded as separate skim files that represent each independent year or year range.
Note
Upon upload of base-year skims, contact us here so that we know to re-run the model specification routine for your region and incorporate travel time sensitivity into the location choice models.
If you would like to automate the two way feedback between your travel model and UrbanSim by integrating the two systems, this can be achieved with a consulting contract. See here for more information or contact us here.
Column Name |
Data Type |
Description |
|---|---|---|
from_zone_id |
Integer |
Origin zone ID |
to_zone_id |
Integer |
Destination zone ID |
[ARBITRARY_COL_NAME] |
Float |
Any number of columns with any arbitrary |
Regional Zoning
The primary mechanism for constraining development capacity in the parcel-level model is the Constraints feature. Constraint records can be added to parcels to reflect zoning, undevelopable areas, and other development regulations. As a convenience for users who have a regional zoning layer, an uploader is available to bulk-load region-wide development constraint information to the platform. Upon upload of zoning, implied parcel-level capacities are calculated, and constraint records are created for each parcel. Built space capacity at the parcel level is a key input to the pro forma model, which is the most common real estate supply model used with the parcel template. For each parcel, the pro forma requires information on maximum floor-area-ratio (FAR), maximum dwelling units per acre (DUA) (units can also be supplied in hectares), and allowable development types under zoning. If maximum building height and other zoning requirements are available, these can be used as well. Additional non-zoning inputs to the pro forma (if available) include development fees and construction costs. The zoning layer should be in the form of a zipped (.zip) shapefile. The shapefile should have the following required fields: zoning_id, max_dua, max_far, allowed_building_types, however there are more optional fields available in the table below. In addition, you must also provide tags to use to link with scenarios and a start year in which the zoning constraint is inserted into the simulation. The zoning constraint will persist until either the end of the simulation or until overridden by another zoning constraint.
Zoning data is typically one of the more challenging categories of data to collect owing to the many forms it can come in from member jurisdictions. If a zoning attribute is relevant in all locations, but data on it has only been collected in some locations, it may be beneficial to not utilize that attribute to constrain development in the model so as to avoid biasing outcomes in favor of areas with less data. If your regional zoning data may have this issue, contact us here to review potential solutions.
In jurisdictions that may not utilize FAR in their zoning code, you may be able to derive FAR if the zoning data has lot coverage and building height or stories information. Otherwise, GIS data on zoning, building footprints, and parcels for a sample of locations in the jurisdiction could be used to estimate lot coverage and then with height information can derive an estimate FAR.
In jurisdictions that may not utilize DUA in their zoning code, you may be able to derive DUA through assumptions about average sqft or sqm per unit in the jurisdiction from census data or other sources.
Note for Australian users: Localization for regions based in Australia should use the term FAR instead of plot ratio for zoning uploads.
Note
The zoning uploader does not yet fully support the conversion of uploaded zoning data to constraint records to be utilized in the parcel-level model. Contact us here to request a conversion of your zoning file to constraint records and UrbanSim will apply your file as a new set of constraints. The data schema for constraint bulk uploads can be found here for data represented as zoning data or here for data represented as UrbanSim constraints.
Column Name |
Data Type |
Unit |
Required |
Description |
|---|---|---|---|---|
zoning_id |
Integer |
Yes |
Unique identifier for the zoning designation |
|
name |
String |
Yes |
Name of zoning designation |
|
zoning_code |
String |
No |
Zoning designation code |
|
min_far |
Float |
No |
Minimum floor-area ratio |
|
max_far |
Float |
Yes |
Maximum floor-area ratio |
|
min_dua |
Float |
Units per acre or hectare |
No |
Minimum dwelling units per acre or hectare |
max_dua |
Float |
Units per acre or hectare |
Yes |
Maximum dwelling units per acre or hectare |
max_height |
Float |
Feet |
No |
Maximum building height |
min_fr_sb |
Float |
Feet or meters |
No |
Minimum front setback |
max_fr_sb |
Float |
Feet or meters |
No |
Maximum front setback |
rear_sb |
Float |
Feet or meters |
No |
Rear setback |
side_sb |
Float |
Feet or meters |
No |
Side setback |
coverage |
Float |
0-100% |
No |
Proportion of parcel land area that can be developed |
allow_bldg |
String |
Yes |
Semicolon (;) delimited list of building_type_id’s |
|
notes |
String |
No |
Notes can be added to include any other pertinent |
Vacancy Rate by Building Type
The vacancy rate by building type table specifies vacancy rates for each building type contained in your base data building types table. This table can be used when crafting a scenario in place of using the simple residential and non-residential vacancy rate inputs and is an optional scenario input. The building_type_ids for the vacancy rate by building type table must correspond to the building_type_ids in the corresponding building types table in the base data collection that has been specified for the scenario. It is not necessary to have vacancy rates for all building types, however any building types that are not specified in the vacancy rate by building type file, UrbanSim will use the default regional vacancy rates for those missing building types where the residential vacancy rate is: (1 - total households / total residential units) and non-residential vacancy rate is: (1 - total jobs / total job spaces). If vacancy rates are unknown for some building types the default vacancy rate for the respective residential or non-residential building type will be used.
Column Name |
Data Type |
Description |
|
|---|---|---|---|
building_type_id |
Integer |
Yes |
ID of the building’s structure type that |
vacancy_rate |
Float |
Yes |
The vacancy rate of each building type expressed |
Other User Uploaded Data
Summary Geography
Arbitrary polygon shapefiles can be uploaded and used to tag development projects with the corresponding polygon IDs for use outside of the platform and to generate summary statistics of development project attributes that fall within the polygons. See development projects reports for more information. The summary geography layer should be in the form of a zipped (.zip) shapefile. The shapefile should have the following field: polygon_id
Note
Parcels are automatically assigned a summary geography polygon_id when a summary geography file is uploaded using a parcel polygon largest area overlap by summary geography polygon intersection operation. This operation is re-run whenever the base data geometry in the initialization collection changes in order to keep the lookup tables up to date.
Column Name |
Data Type |
Description |
|---|---|---|
polygon_id |
Integer |
Polygon ID |
Bulk upload of development projects
Bulk upload of constraints
See the bulk upload of constraints page.
Bulk upload of adjustments
See the bulk upload of adjustments page.
External Modules
Optional external modules are available to applicable parcel model subscribers that contain additional types of file uploads. See here for supported external modules and features.
Footnotes
References