Simulation Runs
A single run is one discrete UrbanSim simulation. Each run is associated with one scenario, and multiple runs can be associated with the same scenario (but may differ in results due to stochasticity). For more information on how simulation runs are counted in your account see the Accounts section.
For parcel model subscribers: If utilized, optional external modules available to applicable parcel model subscribers will run at the end of the UrbanSim simulation and additional external module generated indicators and metrics will be available after the UrbanSim and external module runs have completed. See here for supported parcel model external modules and features.
Note
If your UrbanCanvas account has been delivered to you prior to the completion of your model development consulting contract, please note that the model will not run. Upon completion of your model build out, simulations for your account will be enabled.
Creating a new simulation run
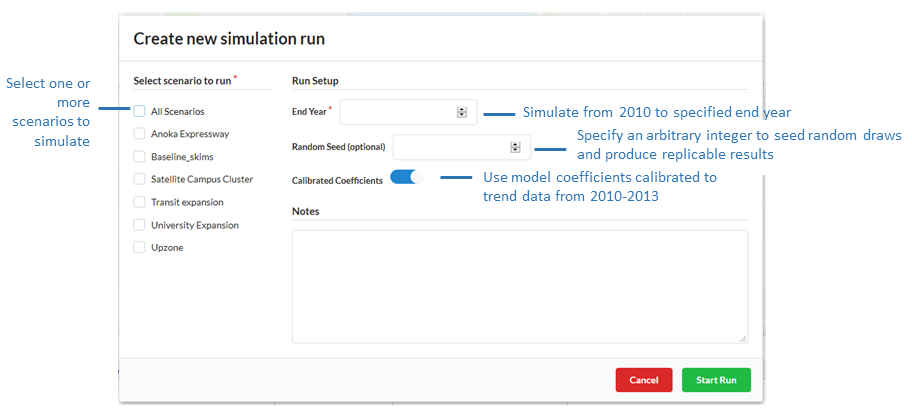
Select scenario to run (Required)
Select one, multiple, or all scenarios to simulate. One simulation will be run for each scenario selected.
End year (Required)
Select the end year for the simulation(s) to run to. This represents your forecast year and the model will run from your base year to specified end year. End-year must be one year greater than your base year. For example if your base year is 2010, your end year must be 2011 or later.
Note
At this time subscribers are limited to simulation end years up to 2050. To simulate past 2050 please contact us here. Subscriber simulation runs are accounted for in two ways: 1) runs with end years under 2020; and 2) runs with end years past 2020. See the Accounts section for more information.
Random Seed (Optional)
Specify an arbitrary integer [1] to seed the random draws in the UrbanSim models for replicable results. Supplying the same integer seed to multiple runs of the same scenario will produce the same results.
Note
If you are running multiple runs that all use the same data and model configuration with the same random seed and are noticing that your results differ from run to run, differences in results may be a result of minor differences in how data are being handled in Python from run to run for example: a) how Pandas DataFrame columns are sorted; or b) how Pandas DataFrame rows are sorted and subsequent operations that are interacting with differently sorted datasets for example when fillna() is used with back fill. We suggest you check locations in the codebase that could introduce random differences in how data are handled from run to run.
Calibrated Coefficients (Optional)
Choose whether to use model coefficients that have been calibrated to observed trends. It is recommended to run the simulation with calibrated coefficients. Click here for more on model calibration for your model type: block model, parcel model, zone model.
Optional fields:
Notes can be saved to runs to add context.
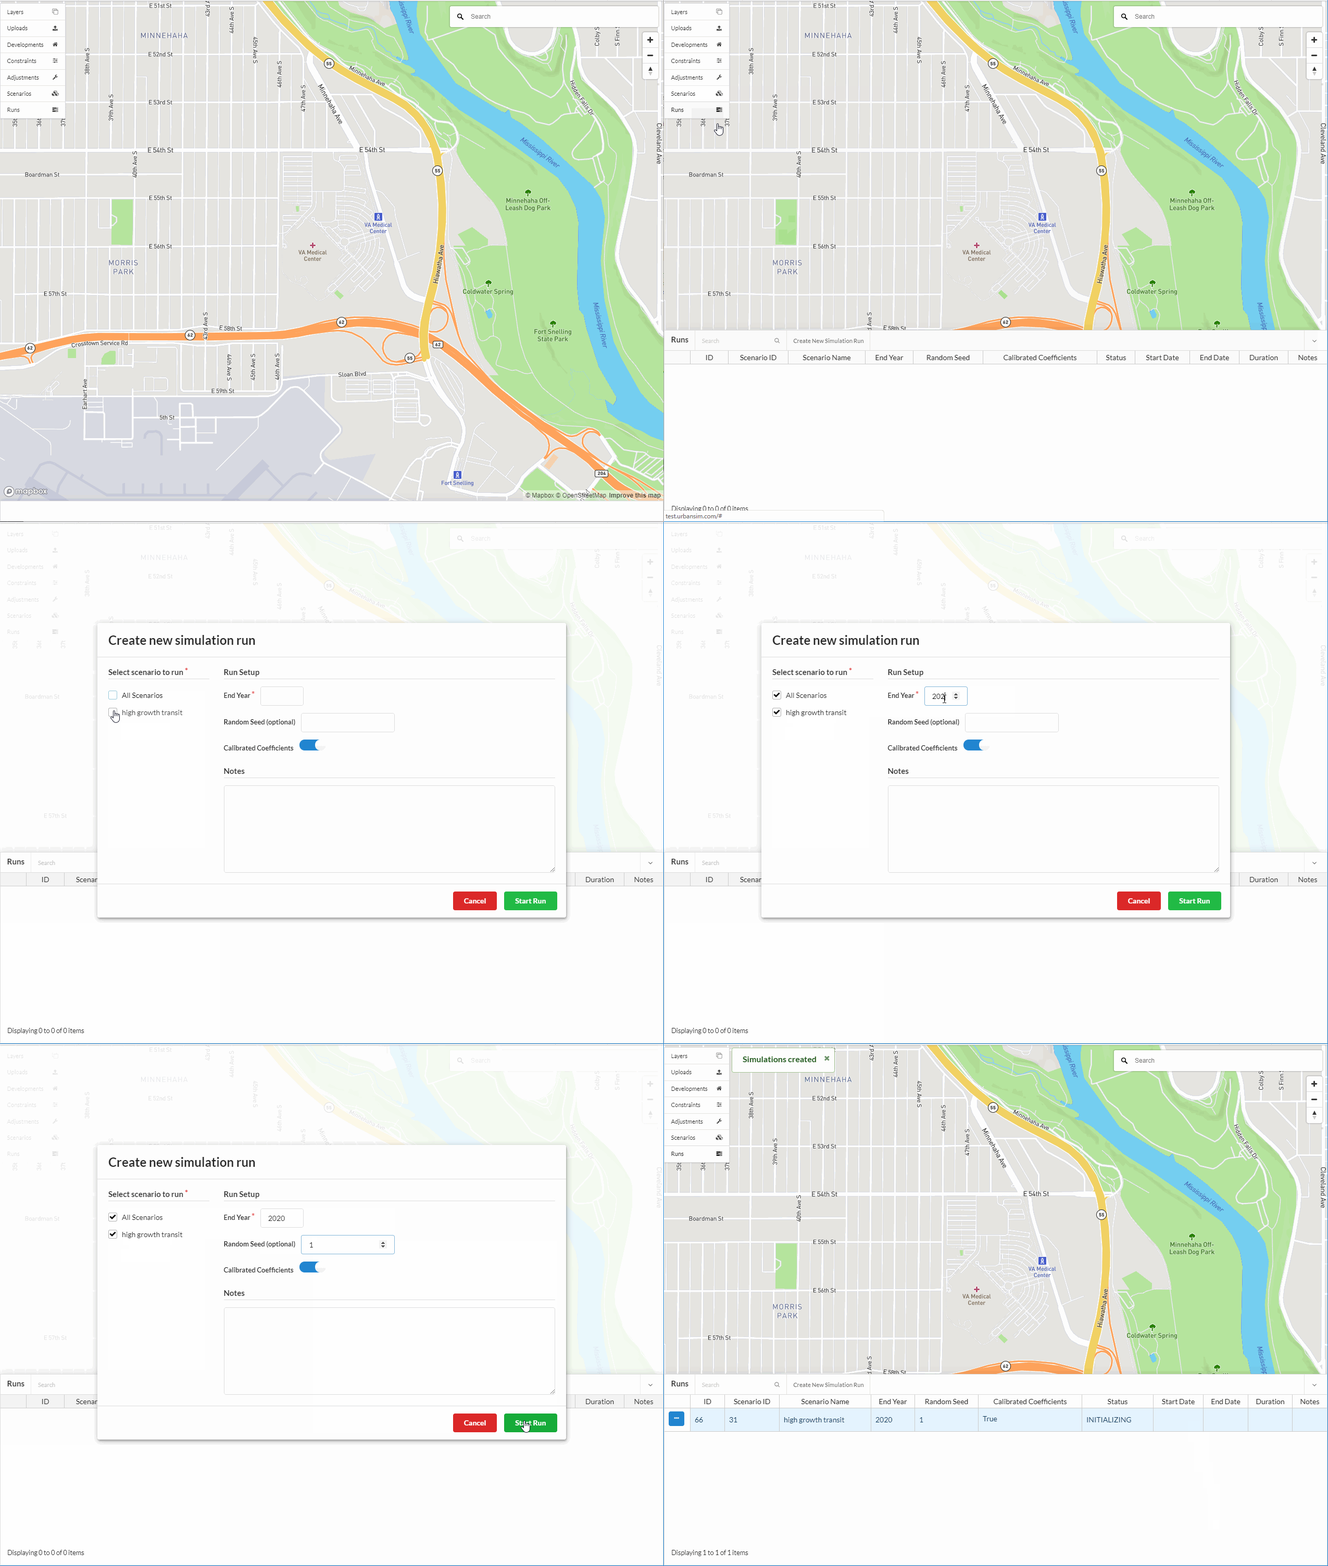
Simulation status, log, & download results

Simulation status
The status of a running simulation can be inspected by clicking the blue button on the left side of the simulation runs table and on the magnifying glass icon where you can monitor the simulation progress bar, the current simulation year, and the current model step that is being simulated.
Note
Simulation status codes:
Initializing: Indicates the compute resources to run the simulation are being prepared.
Pre-Processing: Indicates scenario data and simulation configurations are being transferred to and established on the machine.
Starting: The simulation has been successfully assigned to a machine, and the simulation is reading scenario inputs, loading base data, and setting up the simulation environment.
Running: Simulation is in progress.
Completed: Indicates the simulation has successfully completed.
Canceled: Indicates run was canceled by a user.
Failed: Indicates an error occurred during simulation. Checking the log will provide traceback information to help diagnose the issue.
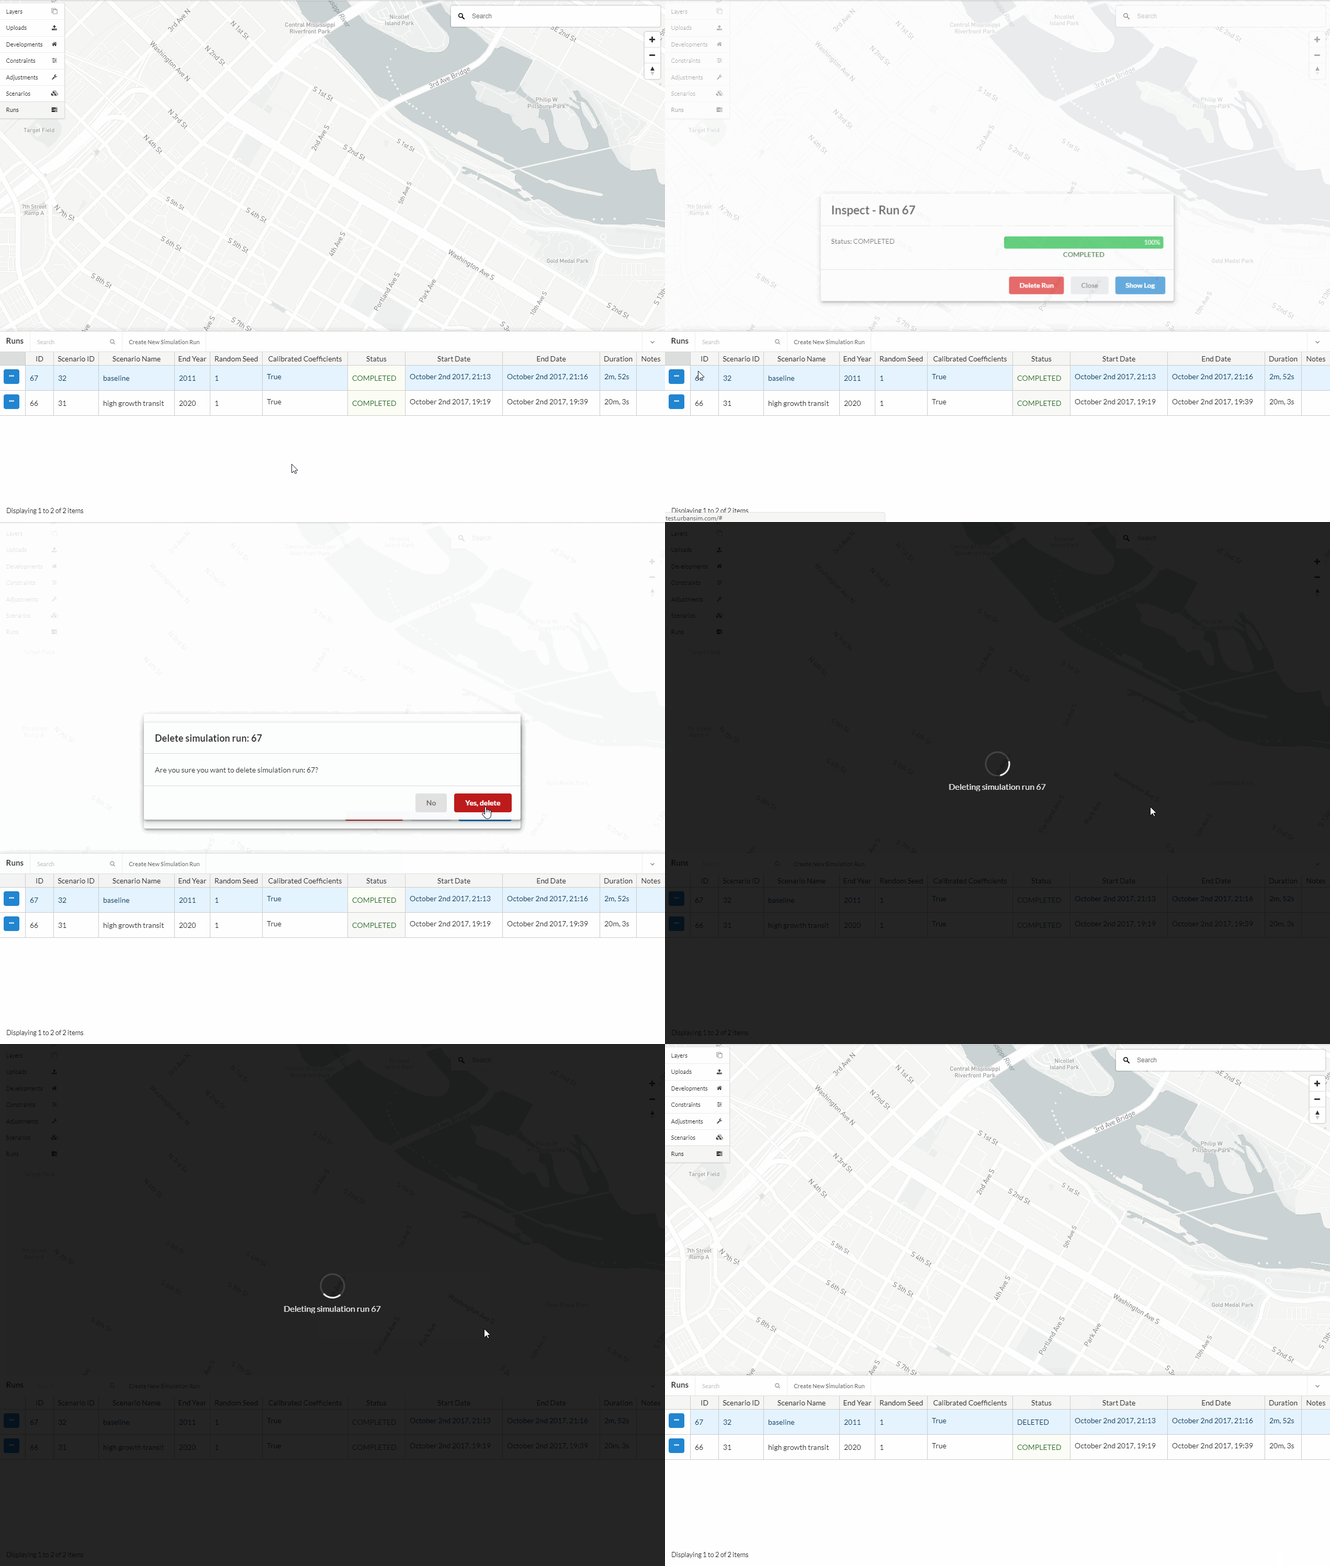
Deleted: Indicates the run has been deleted by a user, however at this time all data associated with that run are preserved.
Simulation log
After a simulation has finished, the log for the simulation run can be viewed in the inspection interface and copied to clipboard. There are two logs available: 1) A simplified log (shown by default); and 2) An advanced log that shows the full traceback for any error encountered. You can switch between the two versions by clicking the plus + and minus - buttons in the log screen.

Downloading simulation results
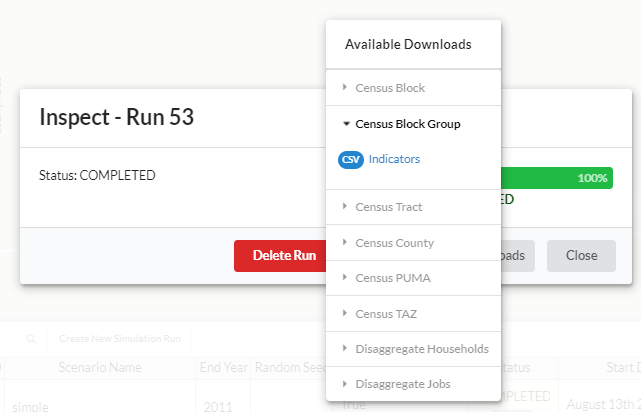
Simulation results, in the form of indicators, for any run can be downloaded by inspecting an existing run, clicking on the Downloads button, and selecting the type of data to download by geography. Downloads can be customized to export any other files of interest resulting from the simulation run. To request specific files to be exported contact us here for details.
Deleting an existing simulation run
Note
At this time deleting an existing simulation run, will not delete the associated indicator data or map layers.
Viewing indicators
Note
The calculation and visualization of indicators are currently in development and can be considered experimental.
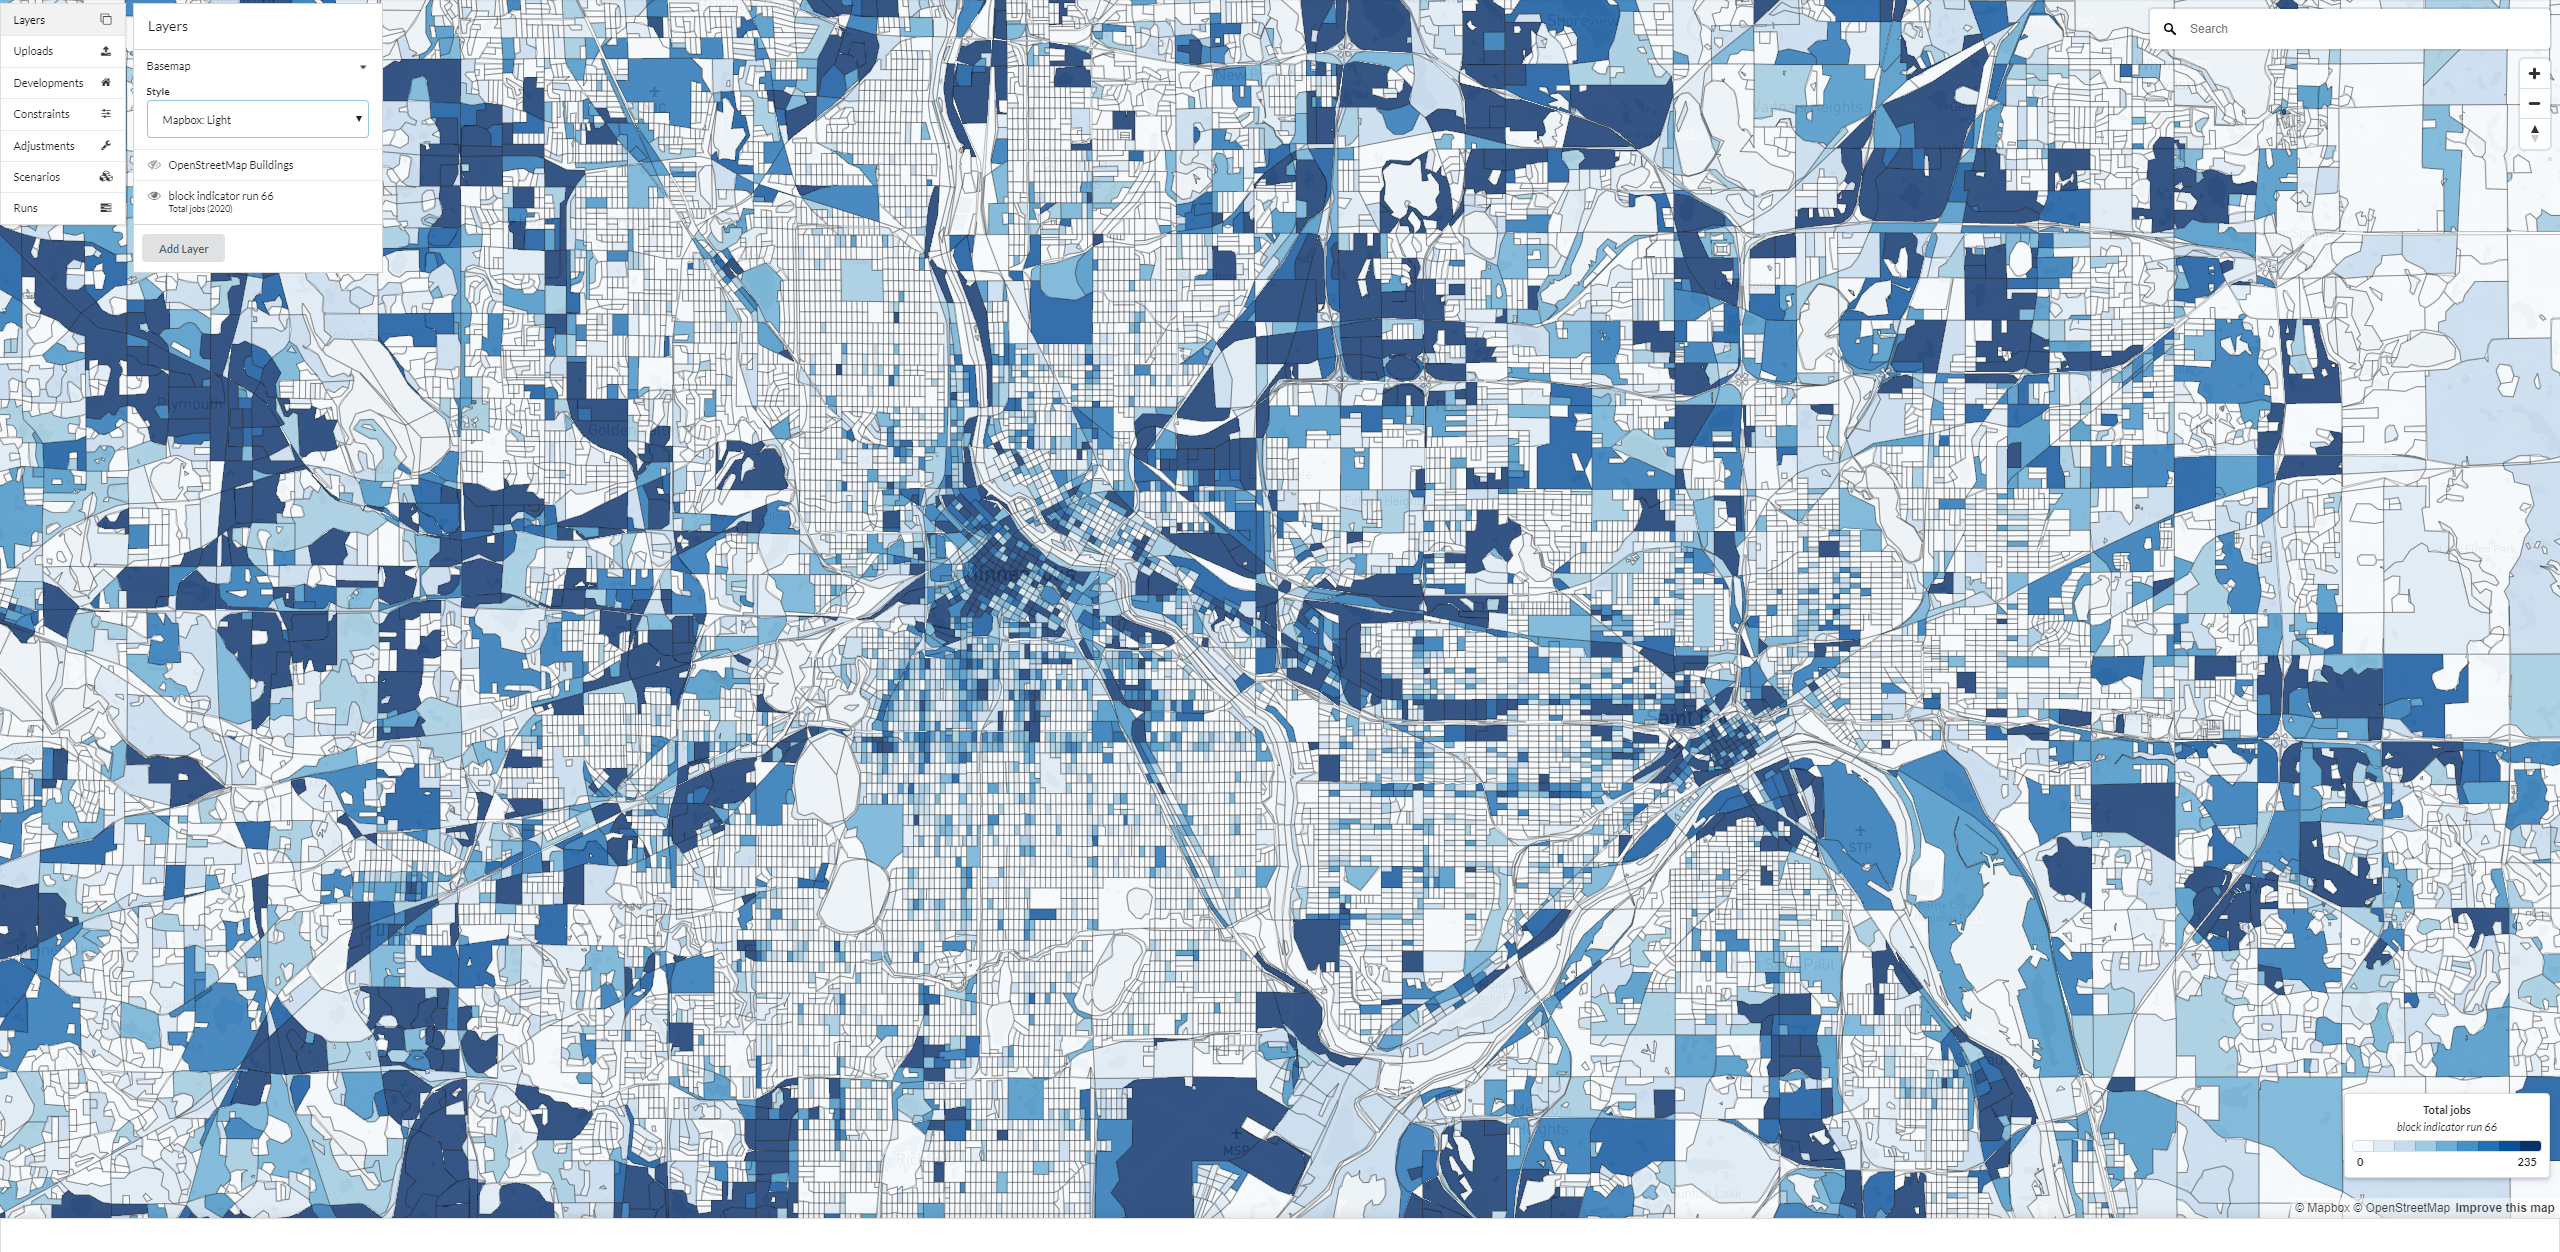
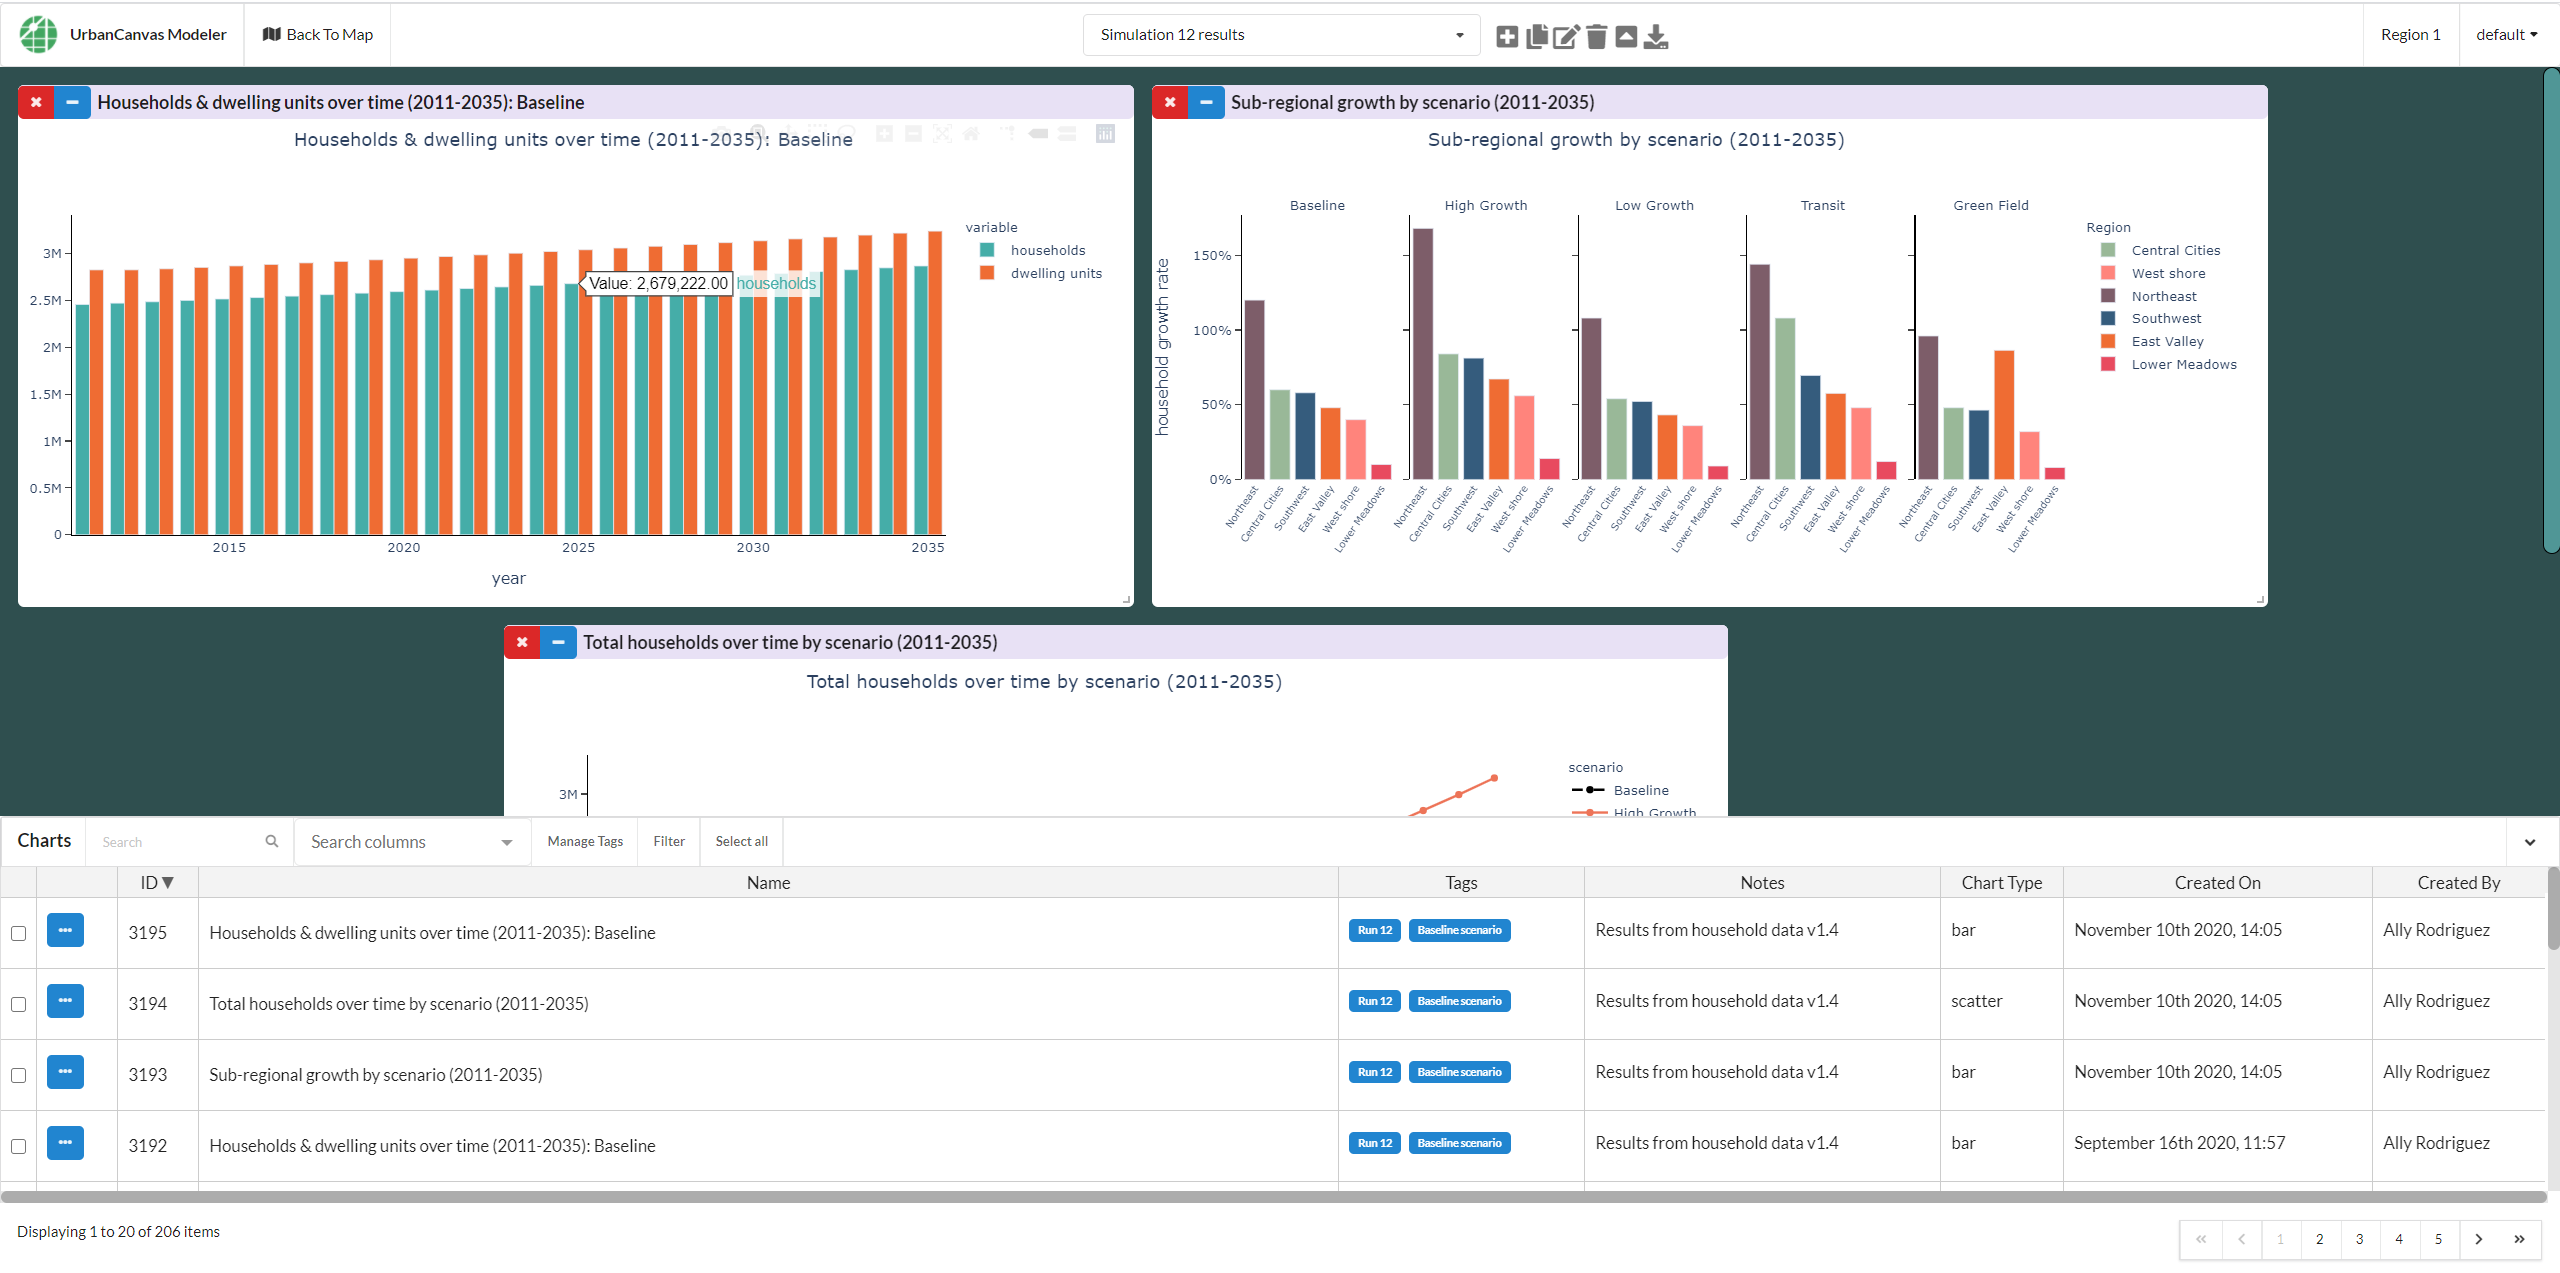
After a successful simulation run, a selection of indicators for that run are available to visualize as layers on the map and as charts. For more details on spatial indicators and to view indicators on the map see the indicators section. For more details on chart indicators and to view charts in UrbanCanvas see the chart dashboard section.
All model types (e.g. Block, Zone, Parcel) can have a customized list of indicator variables autogenerated at various spatial levels and time points as spatial indicators or charts. However, owing to the Block model’s use of standardized data there are a pre-selected set of default spatial indicators and charts currently available which can be further modified.
Notes